
I had wanted to learn about hydroponics for a long time and when the COVID stay-at-home orders came out, I made learning about hydroponics my COVID project. I decided early on that a grow light would be my primary (and biggest) investment. Since then, I have experimented and explored all kinds of different growing methods and systems and I still think choosing a grow light carefully is the most important step.
However, choosing the right grow light is so much easier said than done – I spent a significant amount of time in the beginning just trying to understand all the different ways lights are measured and described. I eventually came to understand that, when choosing lights for growing plants, it really can be simplified quite a lot by ignoring all the unit measures and descriptions given for lights designed for humans. As growers say, “Lumens are for humans, PAR is for plants”. Lumens (and candles) measure the brightness of a light in terms of what the human eye can see. PAR stands for “Photosynthetically Active Radiation” and measures the light plants use for photosynthesis.
Although this difference between PAR and Lumens is generally and widely accepted, I wanted to really understand the difference well enough to be able to explain it to someone. So this post is the result of my own deep-dive into grow lights and my explanation of how to best use artificial light sources for autotrophic (self-feeding – aka photosynthetic) organisms.
Let’s start with light itself. Light is both a wave and a particle. In the first part of this post we’ll focus on the wave-properties of light – later, we’ll talk about particles of light.

In the image above, you can see the numbers at the bottom and the label “wavelength”. A wavelength is the measure of distance from two consecutive, similar points on a single wave – usually from the top (crest) of a wave to the next crest – or from the trough (bottom) of a wave to the next trough. Light waves include a whole lot of things – Gamma rays, x-rays, infrared, and radio waves as well as the visible light spectrum. The visible light spectrum is about in the middle and is relatively very small.
Here is a slice of the light spectrum zoomed in to show only visible light. These light waves are measured in nanometers. For context – there are 1,000,000 (1 million) nanometers in a centimeter.
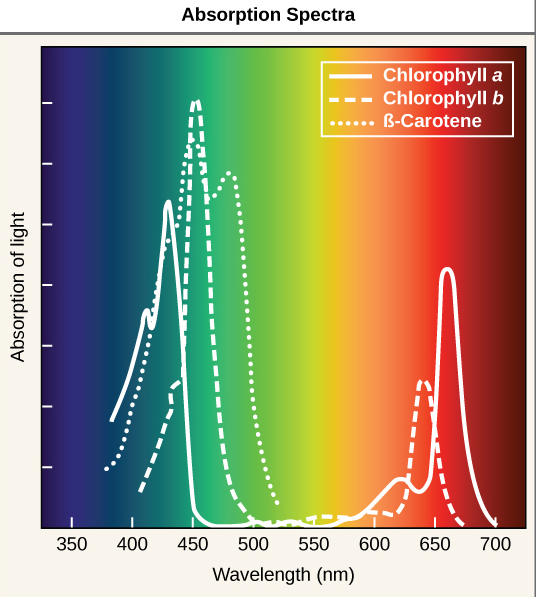
The three white lines (solid, dashed, and dotted) represent the parts of the visible light spectrum that plants use in photosynthesis. Notice, in particular, that plants are especially sensitive to green, green-blue, and red light.
Chlorophyll a represented by the solid line and peaks at about 425 nm in the blue-green light and again at about 660nm in the lighter red light. Chlorophyll b and B-Carotene use green light around 460 nm and 500 nm respectively and Chlorophyll b also uses some red light at about 640 nm.

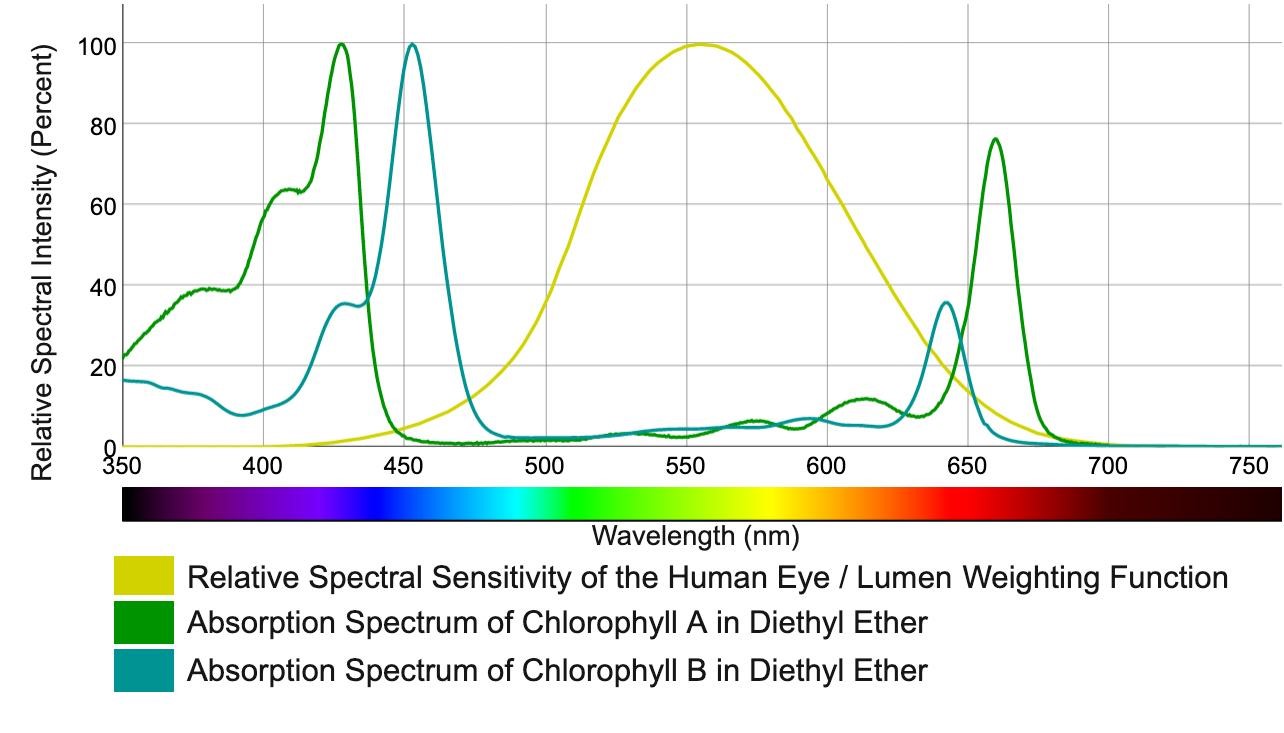
Here is the visible light spectrum again but this time, it is showing only the portions of the visible light spectrum that human eyes are most able to see. Notice that our eyes are most sensitive to light at about 560 nm – in the light green to yellow light range.
If you look back at the plant absorption spectra chart, you can see that, although plants do use some light in that range, it is only a very small amount by comparison.
Here are the two light spectrum absorption ranges – human and plant – placed on top of one another. The light green line shows the relative spectral sensitivity of the human eye and the darker green and green-blue lines show the light absorption levels for plant chlorophyll a and b. There is very little overlap and the peak light spectrum for plants is not included in the light range for humans at all.
Below are graphs showing the typical light spectrum output for common household lights alongside a graph of sunlight. So it’s not hard to how a light designed to feel pleasant and bright to human eyes would not be at all sufficient for a plant.

So, now we have a good idea about why regular household lights don’t work well for plants, let’s talk about PAR (Photosynthetically Active Radiation). PAR is, simply put, the range of the light spectrum that plants use – from about 400 nm to about 700 nm – to photosynthesize.
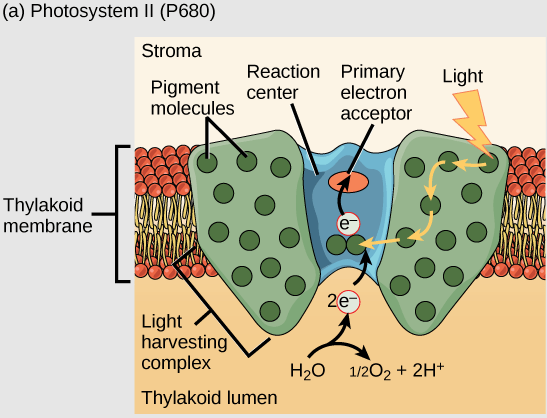
Now we get to talk about light in terms of particles – or photons. When a photon hits a plant pigment molecule in the light harvesting complex, the chain of events that make up photosynthesis begins. The result is energy in the form of ATP and glucose molecules that make it possible for plants to grow and live.
Without those photons, the plant will fail to grow, starve, and eventually die. So the primary concern with a good grow light is the number of photons it produces for the plant.
Photons are measured in μmols (say “micromoles”) and it is a scientific (SI) unit of measure equal to 10−6 (0.000001) moles or one-millionth of a mole. Remember moles from chemistry class? Here’s a quick refresher; The mole (symbol: mol) is the base unit of amount of substance in SI units defined as exactly 6.02214076×10²³ particles. So one millionth of a mole is somewhere between 6 quadrillion and 6 quintillion particles. …. ok, ok, calculating that was fun, but not helpful – let’s just stick with 6.022×10¹⁷ particles is equal to ONE micromole (μmol).
Now we want to know how many μmols a grow light can output per second over one square meter. Another way to notate this is μmol/second(s)/meter2. This measure is referred to as the Photosynthetic Photon Flux Density or PPFD and is used to quantify PAR. Remember, PAR (Photosynthetically Active Radiation) is the range of light plants can use. We can figure out how much PAR a given grow light provides your plants by calculating its PPFD. I used the D in PPFD (Density) to help me remember – something with high density has a lot while something with low density has a little.
Ok, to recap, we are trying to measure the output of a grow light by the number of micromoles it outputs each second over a 1 meter square area. It would be helpful to know how much per hour or day.
So here are our variables written as conversion factors:
- 1 hour = 3,600 seconds
- 1 mole = 1,000,000 micromoles
Let’s say we have a grow light with a PPFD of 300. Now we’re ready to calculate our PPFD over one hour; (300 PPFD * 3,600 s) = 1,080,000 micromoles per hour per meter squared. We can simplify this number for ourselves just a bit more by dividing by a million (1,000,000) to convert from micromoles to moles. So now we have (300 PPFD * 3,600 s) /1,000,000 micromoles = 1.08 moles of photons per hour per meter squared. This is interesting, but not totally helpful… yet. So let’s keep going.
We know plants need more than 1 hour of light, but how many hours? How long should you leave your grow light on for your plant? Or, to put it in grower terms; what’s the photoperiod? Let’s start with 12 hours which is a pretty reasonable average amount of daylight for a plant to get. We take our previous calculation for one hour and multiply it by our photoperiod of 12: (300 PPFD * 3,600 s * 12 hours) /1,000,000 micromoles = 12.96 moles of photons per hour per meter squared.
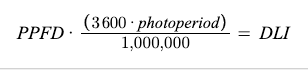
Before I continue, here’s another term for you; Daily Light Integral or DLI – we can use this to replace that mouthful we have at the end of our calculation. DLI = “moles of photons per hour per meter squared.” Now we have a much tidier and more helpful calculation to work with:
Now that we can calculate DLI, we can start to use this information to ensure that plants are getting the light they need.
Most plants will grow well within a range of DLI. How well the plant grows depends on a a number of variables in addition to light levels, including what nutrients it is getting, how well established its roots are, the ambient temperature in the growing area, the airflow, the overall health of the plant, and so on.
However, there are some definite signs that a plant is getting too much or too little light. Too little and you may see the plant become weak and “leggy” meaning it is growing longer and longer in search of more light. Too much light can result in dehydration and leaf burn.
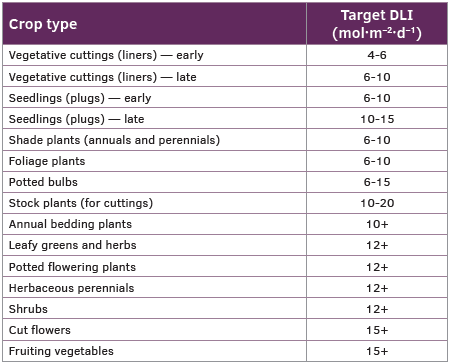
There are all kinds of research papers and information from extension services as well as reputable growers blogs where you can find info about ideal light conditions for specific species of plants. I made a little collection of cheat-sheet (reference cards) for myself: Hydroponic plant requirements, but it’s always best to pay close attention to your plants and adjust your growing conditions based on your own observations.
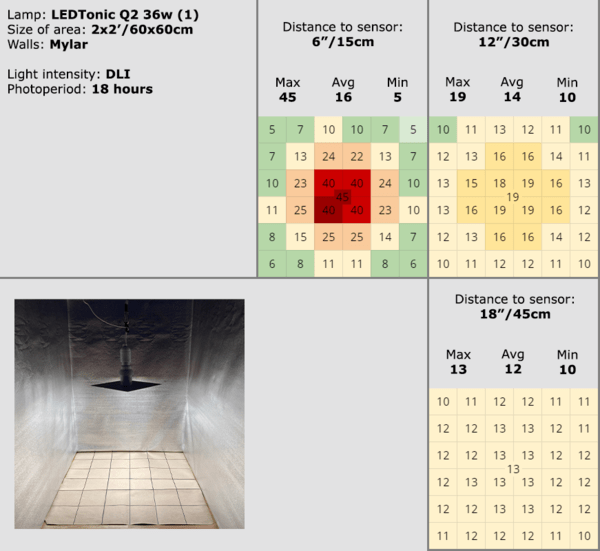
There’s just a few more tweaks we need to make to this understanding of grow lights, PPFD, and DLI. The PPFD number reported on a grow light is measured from a specific distance and often from multiple distances with a map of the growing area coverage. Here are three different light maps from LEDTonic to give you a better idea of how this works. Notice how the areas directly under the light have the highest PPFD and the further away from the light, the lower the PPFD across the whole area.


Now that you know how to calculate DLI for your light, here’s a chart so you don’t have to!
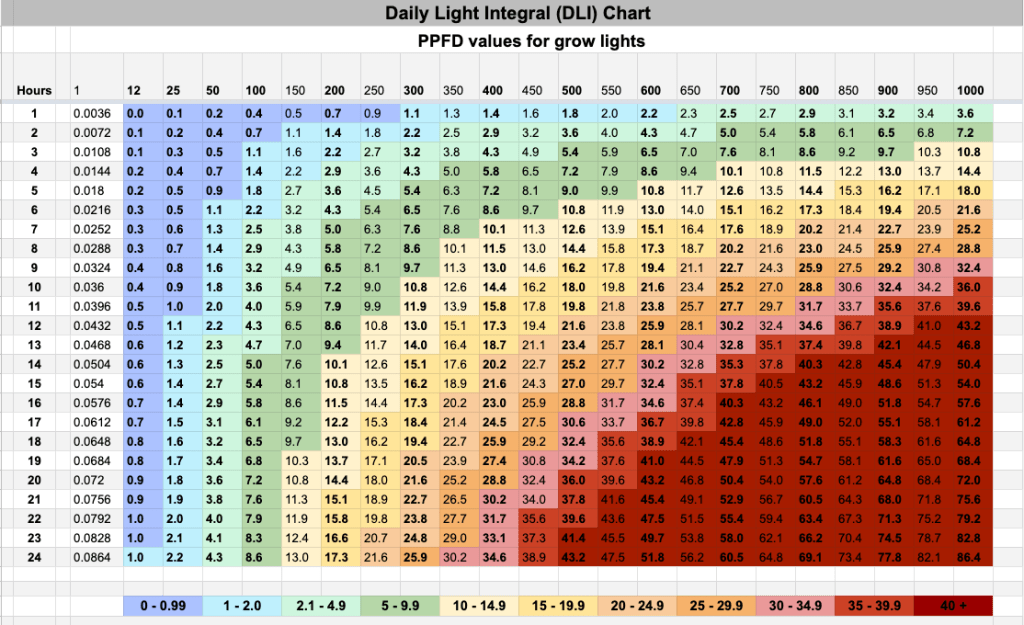
You can view and copy this file: Daily Light Integral Chart
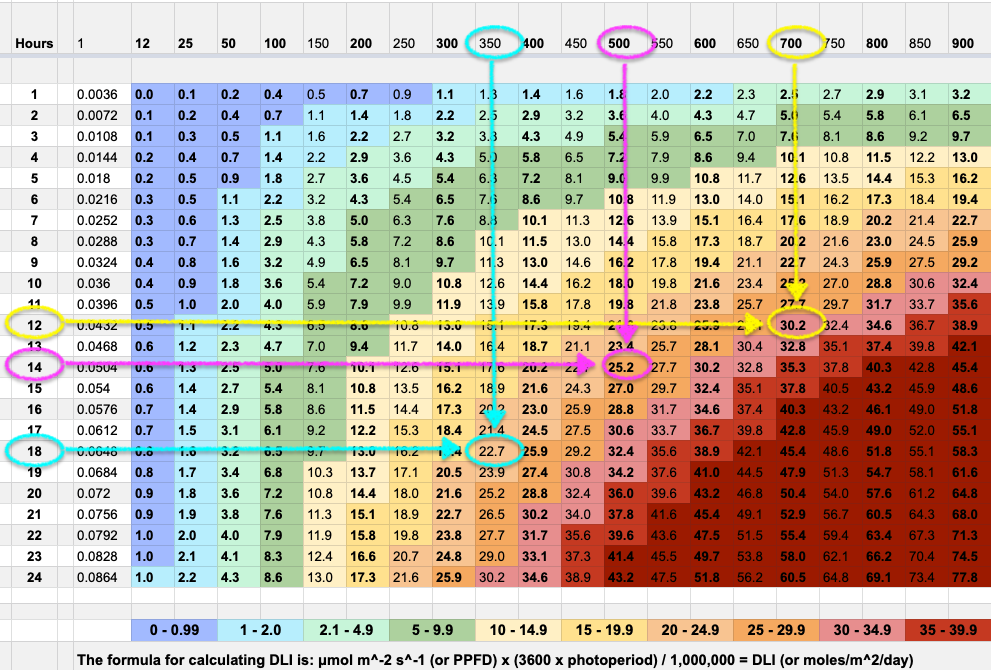
I use this chart fairly often – almost any time I rearrange my plants under my light, I measure and map them to my light’s PPFD and check what DLI each plant is getting. Here’s an example – let’s say you have some tomato plants and you decide to aim for a DLI range of 22 – 30 for these tomatoes.
If you have a grow light with a PPFD of around 350, you could set your photoperiod to 18 hours in order to hit the minimum of your range (see the blue arrows and circles). I like to limit my photoperiod to not more than 18 hours in order to give plants a bit of a rest – it lets things cool off and settle a bit. A drop in temperature or a period of darkness is actually key to certain parts of some plant life cycles.
If you had a light with a PPFD of 700, you would set your photoperiod to no more than 12 hours in order to not exceed your maximum DLI. Of course, a nice place to start is somewhere in the middle – if you have a light with a PPFD of 500 and you set your photoperiod to 14 hours, your plants would receive a DLI of about 25.
References:
Apogee Instruments. Conversion – Instantaneous PPFD to Integrated PPFD. https://www.apogeeinstruments.com/conversion-instantaneous-ppfd-to-integrated-ppfd/. Accessed 11/18/2021.
Atop Lighting. How to choose a reliable LED grow light -Part one and part two. https://www.atophort.com/news/how-to-choose-a-reliable-led-grow-light-part-one.html. Accessed 11/18/2021. https://www.atophort.com/news/how-to-choose-a-reliable-led-grow-light-part-two.html. Accessed 11/18/2021.
Dutta Gupta, Snehasish & Agarwal, Avinash. (2017). Artificial Lighting System for Plant Growth and Development: Chronological Advancement, Working Principles, and Comparative Assessment. 10.1007/978-981-10-5807-3_1.
Fondriest Staff on August 12, 2010. What is Photosynthetically Active Radiation? https://www.fondriest.com/news/photosyntheticradiation.htm. Accessed 11/18/2021.
Frender, Kevin . How light spectrum impacts cannabis plants. https://terpenesandtesting.com/how-light-spectrum-impacts-cannabis-plants/. Accessed 11/18/2021.
LedTonic. MAY 28, 2019 [Updated 02 March 2021]. DLI (Daily Light Integral) Chart – Understand your plants’ PPFD & photoperiod requirements. https://www.ledtonic.com/blogs/guides/dli-daily-light-integral-chart-understand-your-plants-ppfd-photoperiod-requirements. Accessed; November 2021.
OpenStax, Biology. OpenStax CNX. Sep 29, 2015 http://cnx.org/contents/185cbf87-c72e-48f5-b51e-f14f21b5eabd@9.87.
Runkle, Eric. DLI ‘Requirements’. https://gpnmag.com/article/dli-requirements/. Accessed 11/18/2021.
Shelford, Timothy & Both, A.J.. (2020). Plant Production in Controlled Environments. 10.21061/IntroBiosystemsEngineering/Plant_Controlled_Environment.
