
This is a summary of the paper “Census of heat tolerance among Florida’s threatened staghorn corals finds resilient individuals throughout existing nursery populations” 1 which presents research findings on tests conducted to measure heat tolerance of Staghorn Coral (Acropora Cervicornis) which is critically endangered and a focal species for most restoration efforts in the Florida Keys. Note that there is some text highlighted to indicate that I do not fully understand the information presented and plan to do further research and learning on the topic(s).
Introduction
As the effects of climate change increase, organizations throughout the Florida keys have ramped up their restoration efforts. However, without identifying heat-tolerant corals, these restoration efforts cannot succeed. Heat-tolerant corals are crucial to conservation efforts for a number of reasons including; outplanting more resilient corals in restoration projects, selective breeding, and understanding the evolutionary potential of coral species.
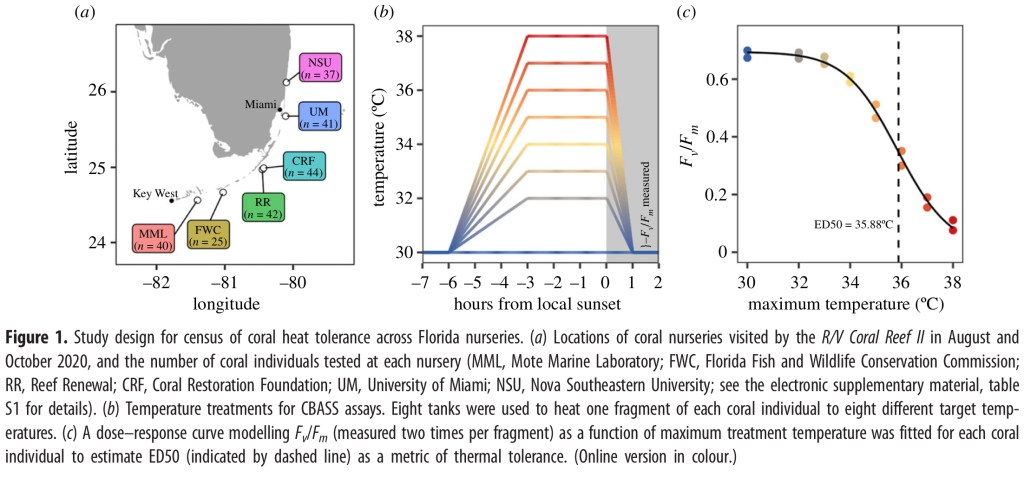
In this study, samples were taken from six coral nurseries that spanned the southern coast region of Florida that makes up the Florida Coral Reef (figure 1a) and “represent an ideal population in which to quantify variation in thermal tolerance owing to coral genotype, because corals are common gardened in each nursery environment, and associate with the same algal symbiont species (Symbiodinium ‘fitti’) across this gradient.2 In this context, common garden refers to the fact the corals present in the nurseries represented “species or populations collected from multiple distinct geographic locations, grown together under shared conditions”. 3
Materials and Methods
In this experiment thermal tolerance was measured in 229 samples of A. cervicornis colonies from six different coral nurseries. Thermal tolerance was tested using CBASS to independently expose coral fragments to eight temperature stress profiles of increasing magnitude from 30°C to 38°C for 7 hours. The heat tolerance was measured using the maximum photochemical efficiency (Fv/Fm) (figure 1b). This data was then used to construct a dose response curve from which the Effective Dose (ED50) could be calculated (figure 1c).
CBASS setup and assay procedure
The CBASS system was set up using the general design of Voolstra et al 4 with temperature profiles controlled using ELEGOO Mega 2560, which is similar to an Arduino system. A flow through pump system moved water through the tanks and light was provided using LED aquarium lights (Philzon 165W) to provide 550μmol photos m-1 s-1. PAR levels were measured using Apogee Instruments at the center of each tank at the level of the coral fragments.
Temperature profiles began with a baseline of 30°C that ramped up over a 3-hour period to the maximum temperature for the profile which was held for 3 hours and then a 1 hour ramp down. Temperature profiles were timed so that the maximum hold period happened at local sunset and the ramp-down period took place in darkness.
After returning to 30°C, Fv/Fm was measured using a DIVING-PAM-II chlorophyll fluorometer from two non-overlapping areas of coral tissue that was facing upwards, perpendicular to the incident light (light that reaches a surface before it’s changed by reflection, absorption, or transmission).
CBASS deployment and field operations
The CBASS was set up on the deck of a research vessel and researchers traveled to each of the participating coral nurseries. At each nursery, divers collected eight coral ramets (a fragment of coral that can establish a new colony) of about 5 cm in length from each of the available genets (single genetic source). Each nursery provided between 25 – 44 genets for a total of 229 genets from all nurseries combined. There was some overlap in genets between nurseries so there were a total of 172 unique genets across all the nurseries. These fragments were then held in the ship’s livewell system and assayed within 1-2 days of collection.
One hour prior to temperature ramping, the coral fragments were placed in the experimental tanks at 30°C. One fragment from each colony was placed in each experimental tank in a consistent location so that multiple colonies could be assayed at one time. At the end of each run Fv/Fm data was collected.
CBASS data analysis and ED50 calculations
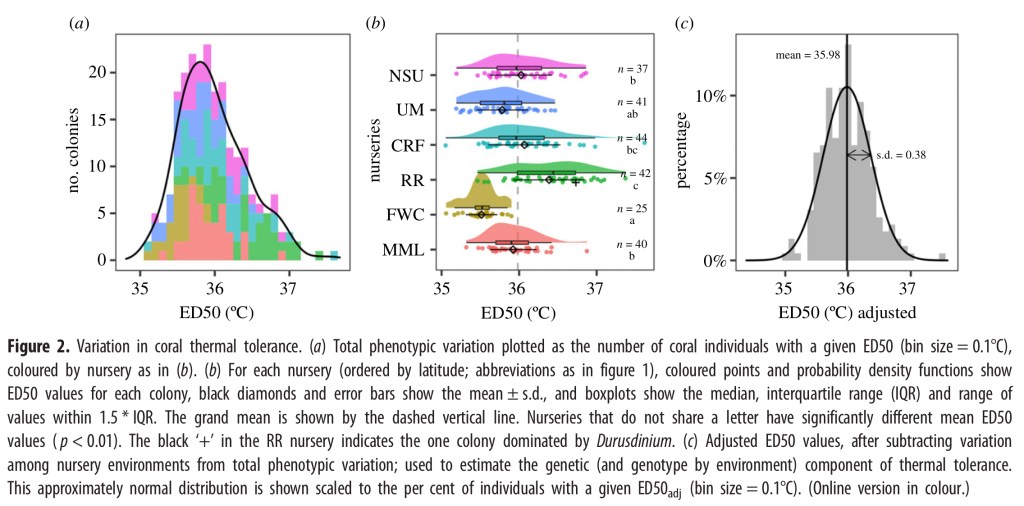
The image below illustrates the variation in coral thermal tolerance data. Figure 2a shows the total phenotypic variation plotted as the number of coral individuals with a given ED50 grouped in 0.1°C increments and coloured by nursery. Overall, the curve is roughly normal with a slight skew to the right showing a greater number of individuals with a higher thermal tolerance.
Graph 2b shows data for each nursery (ordered by latitude) shows the distribution of ED50 values for each colony. The black diamonds and error bars show the mean ± s.d., and boxplots show the median, interquartile range (IQR) and range of values within 1.5 * IQR. The black ‘+’ in the RR nursery indicates the one colony dominated by Durusdinium which is a different species of Symbiodinium.
Graph 2c shows the adjusted ED50 values, after removing some inconsistent variables among nursery environments. This approximately normal distribution is shown scaled to the percent of individuals with a given ED50 value using 0.1°C increments.
Coral source colony locations and temperature regimes
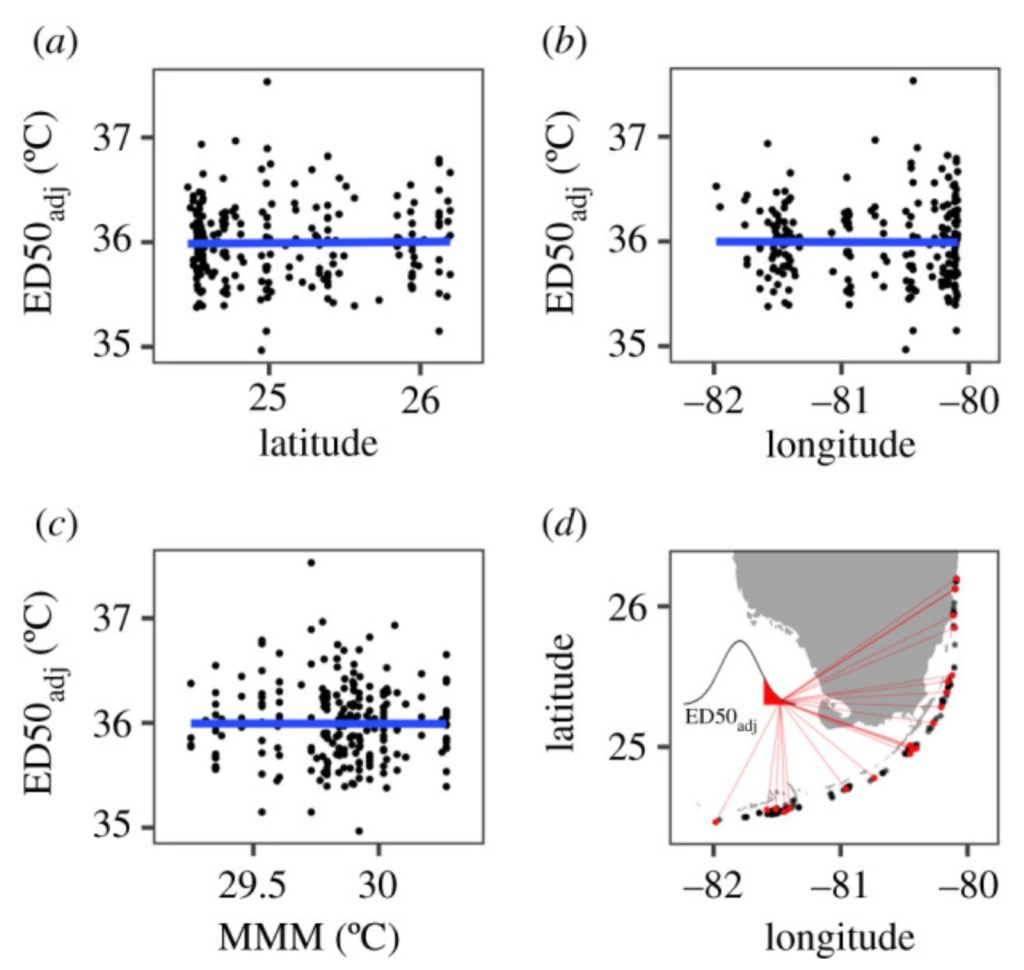
All the staghorn coral collected by the nurseries and used in this experiment were gathered from wild colonies with the source latitude and longitude recorded. Using these source latitude and longitude coordinates, a comparison was made of the CBASS data results and the NOAA satellite surface sea temperature (SST) using a 5km resolution to calculate the maximum monthly mean (MMM) as the average temperature for the hottest month. This data was then used to test for predictive relationships with thermal tolerance phenotypes.
The image below shows the results of this test. The blue line represents the linear model fit, none of which were significantly different from zero indicating that the phenotypes with higher thermal tolerance in the CBASS tests were likely not a result of source location.
Symbiodiniaceae analysis
Small biopsies of healthy tissue were collected from each colony and preserved in a DNA buffer. The DNA was extracted and analyzed to identify and quantify the Symbiodiniaceae. The clades Symbiodinium and Durusdinium were identified using genus-specific qPR assays.
Results
Variation in thermal tolerance phenotypes
Thermal tolerance metrics (ED50 values) were recorded for 229 coral colonies across six different nurseries representing a total of 172 unique genets (genetic individuals) across all six nurseries. The phenotypic variation in thermal tolerances based on the measurement metric ED50 was between 35.05°C to 37.62°C, representing a range of about 2.57°C with a median value of 35.92°C.
However, the variance is not equal across the nurseries. Coral from CRF (Coral Restoration Foundation) had the highest and lowest individual values as well as the highest variation while corals at RR (Reef Renewal) had the highest thermal tolerance overall. Researchers analyzed the data to determine the cause of the variation between nurseries.
Variation of the Symbiodiniaceae genera could be excluded because all the colonies hosted Symbiodinium, except for a single individual at RR that was dominated by Durusdinium. Similarly, the researchers were able to exclude the concentration of Symbiodinium in the host cell as well as the location; latitude, longitude or MMM temperature of the source colonies.
Finally, in order to determine whether the variation in thermal tolerant phenotypes were genetically fixed or environmentally plastic, the ED50 was compared for coral genomes that were present at multiple nurseries. However results showed no correlation between nurseries for any of the metrics measured and analyzed.
Capturing thermal tolerance variation in coral collections
Using the data from these experiments, researchers determined that, in order for a sample of coral genets taken from a nursery to capture at least 50% of the thermal tolerance range, they would need to randomly select 7 to 8 coral genets. In order to have a greater than 90% probability of capturing at least one thermally tolerant coral in the sampleset, 6 to 7 coral need to be sampled from Reef Renewal, University of Miami, Nova Southeastern University or Coral Restoration Foundation or 11 genets from Mote Marine Laboratory and Florida Wildlife Commission. Figure four b illustrates this sample selection rate below.

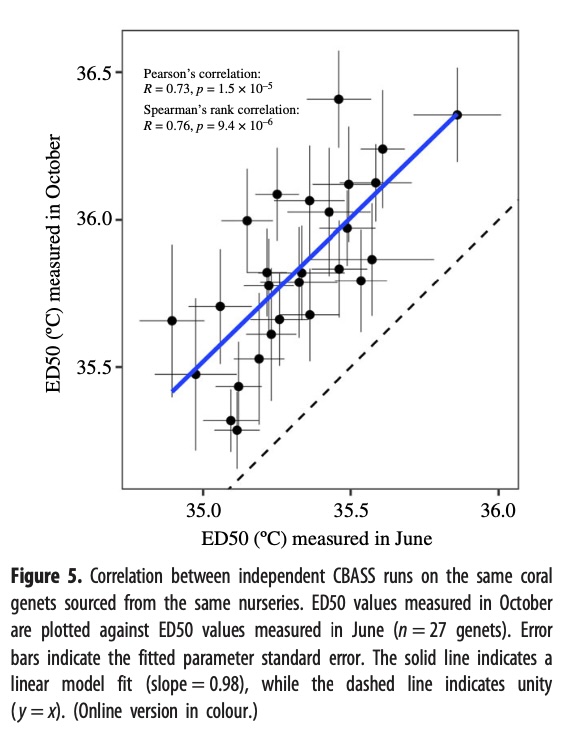
Reproducibility of thermal tolerance phenotypes using CBASS
To verify the reproducibility of these experiments, 27 genets from the same nurseries tested in October were also tested in an independent set of CBASS experiments in June of the same year. The results showed a strong, positive linear relationship between the two independent experiments. Though, it was noted that the ED50 values measured in October averaged 0.51°C higher than values measured in June. The image below illustrates this data.
Discussion
As of the date of publication, this paper represents the first large-scale effort to assess the thermal tolerance of staghorn coral in Florida. The researchers found that there actually was a great deal of variance in the thermal tolerance of the corals tested – ranging from a minimum of 35.05°C to a maximum of 37.62°C. While these temperatures don’t necessarily reflect what would happen in the wild during a bleaching event, this information enables us to compare the different thermal tolerances amongst individual genotypes.
Because it was possible that some of the thermal tolerance may have been due to acclimatization and environmental hardening in the specific nursery environments rather than innate genetic thermal tolerance, the researchers compared data collected from the duplicated genotypes across nurseries. They found that the nursery site accounted for only 37% of the total variation indicating that the differences in the acclimatization effect of the nursery environment was likely not the main contributing factor to thermal tolerance. Similarly, the average thermal tolerance at each nursery did not correlate with the local maximum monthly mean (MMM) temperatures indicating that it is unlikely the thermal tolerances recorded by CBASS were due to this factor either.
Most interestingly it was found that approximately 63% of the total variation in thermal tolerance actually occurred within the nurseries across all the testing sites. This means that the thermal tolerances recorded are most likely due to the individual’s genomes and that each nursery contains coral phenotypes that have a higher thermal tolerance than the average population.
This is great news for the coral nurseries who can immediately act on this information by focusing their restoration efforts on the individual phenotypes with higher thermal tolerance. By doing so, the hope is that these individual genotypes will have a greater chance of surviving in the wild and would contribute more heat tolerance alleles to the local gene pool.
There’s more good news for coral restoration efforts and coral nurseries when it comes to sourcing more coral genotypes and increasing genetic diversity within the nursery. Though it was suspected that more heat tolerant genotypes would be found in hotter areas this study and another conducted by Cornwell at al. 5 have found heat tolerant individuals similarly distributed across locations that were studied. Findings showed that there was a fairly consistent distribution of thermal tolerant individuals within nurseries and between each nursery that was not related to latitude, longitude, or the original colonies from which the fragments were collected.
This means that local coral restoration organizations and coral nurseries can start identifying and collecting coral fragments from local sources knowing that they have a high statistical probability of getting a phenotype with high thermal tolerance. This is important given the complexity of the coral holobiont, it is possible that a coral individual with a high thermal tolerance in one region may not do as well if it were moved to another location.
The experiment was repeated on the same coral genet from the same nursery using a different experimental system in a different location several months apart June and October, in order to test the reproducibility of the experiment the result show that they were highly correlated, indicating that it was a reproducible tolerant tolerance phenotype note that thermal average 5°C higher in October than June which could be due to seasonal acclimatization because it’s typically much hotter in September or it could be due to some inconsistencies in the experimental systems.
The quantitative thermal tolerance data provided by CBASS is also critical in helping with the efforts to identify genomic features associated with thermal tolerance. Prior to the development of CBASS, these studies have relied on bleaching responses observed in the wild where there are too many uncontrollable variables to get solidly useful data. Hopefully this and other studies like it will help to identify the exact part of the coral DNA responsible for thermal tolerance.
Finally, while the results of the study are very exciting it’s important to keep the whole picture in mind Thermal tolerance is a very important criteria for survival, but it has to be viewed within the context of the whole coral hollow bond because the performing where thermal tolerance is concerned may or may not handle other stressors as well such as disease, resistance, growth, rate and lesion healing so well Talance is a critical factor it’s just one component of coral restoration. It’s important to keep all of this in mind because the ultimate goal of coral restoration is to create a self-sustaining biologically, diverse reef community while still influencing the genetic makeup of the coral to be more survivable in the face of climate change.
In the short term, however, the highlights, some very immediate and actionable ways in which restoration can increase the thermal tolerance of the corals that they work with
Citations:
- Cunning Ross, Parker Katherine E., Johnson-Sapp Kelsey, Karp Richard F., Wen Alexandra D., Williamson Olivia M., Bartels Erich, D’Alessandro Martine, Gilliam David S., Hanson Grace, Levy Jessica, Lirman Diego, Maxwell Kerry, Million Wyatt C., Moulding Alison L., Moura Amelia, Muller Erinn M., Nedimyer Ken, Reckenbeil Brian, van Hooidonk Ruben, Dahlgren Craig, Kenkel Carly, Parkinson John E. and Baker Andrew C. 2021. Census of heat tolerance among Florida’s threatened staghorn corals finds resilient individuals throughout existing nursery populations. Proc. R. Soc. B.28820211613. http://doi.org/10.1098/rspb.2021.1613 ↩︎
- Cunning Ross, Parker Katherine E., Johnson-Sapp Kelsey, Karp Richard F., Wen Alexandra D., Williamson Olivia M., Bartels Erich, D’Alessandro Martine, Gilliam David S., Hanson Grace, Levy Jessica, Lirman Diego, Maxwell Kerry, Million Wyatt C., Moulding Alison L., Moura Amelia, Muller Erinn M., Nedimyer Ken, Reckenbeil Brian, van Hooidonk Ruben, Dahlgren Craig, Kenkel Carly, Parkinson John E. and Baker Andrew C. 2021. Census of heat tolerance among Florida’s threatened staghorn corals finds resilient individuals throughout existing nursery populations. Proc. R. Soc. B.28820211613. http://doi.org/10.1098/rspb.2021.1613 ↩︎
- Susanne Schwinning, Christopher J. Lorti, Todd C. Esque, Lesley A. DeFalco. 2022. What common-garden experiments tell us about climate responses in plants. Journal of Ecology. Western Ecological Research Center. USGS Publications Warehouse. DOI 10.1111/1365-2745.13887. ↩︎
- Voolstra CR, Buitrago-López C, Perna G, Cárdenas A, Hume BCC, Rädecker N, Barshis DJ. 2020 Standardized short-term acute heat stress assays resolve historical differences in coral thermotolerance across microhabitat reef sites. Glob. Change Biol. 26, 4328–4343. (doi:10.1111/gcb. 15148)) ↩︎
- Census of heat tolerance among Florida’s threatened staghorn corals finds resilient individuals throughout existing nursery populations
Cornwell B, Armstrong K, Walker NS, Lippert M, Nestor V, Golbuu Y, Palumbi SR. 2021 Widespread variation in heat tolerance and symbiont load are associated with growth tradeoffs in the coral Acropora hyacinthus in Palau. Elife 10, e64790. (doi:10.7554/eLife.64790) ↩︎
Cunning Ross, Parker Katherine E., Johnson-Sapp Kelsey, Karp Richard F., Wen Alexandra D., Williamson Olivia M., Bartels Erich, D’Alessandro Martine, Gilliam David S., Hanson Grace, Levy Jessica, Lirman Diego, Maxwell Kerry, Million Wyatt C., Moulding Alison L., Moura Amelia, Muller Erinn M., Nedimyer Ken, Reckenbeil Brian, van Hooidonk Ruben, Dahlgren Craig, Kenkel Carly, Parkinson John E. and Baker Andrew C. 2021. Census of heat tolerance among Florida’s threatened staghorn corals finds resilient individuals throughout existing nursery populations. Proc. R. Soc. B.28820211613. http://doi.org/10.1098/rspb.2021.1613
