
Abstract
Exaiptasia diaphana (aiptasia) is a widely used model for studying cnidarian symbiosis and microbiomes. The microbiome of aiptasia and other cnidarians plays an important role in host health, with some bacterial species demonstrating probiotic capacity under stress. However, relatively little is known about most microbiome members beyond 16S rRNA sequencing. This is due to both the diversity of microbiome members and the difficulty of culturing bacteria with unknown metabolic and environmental requirements, compounded by limitations of 16S-based identification. While highly conserved, 16S often does not provide reliable species-level resolution.
To address the limitations of 16S sequencing, this study used a polyphasic approach to improve taxonomic resolution of an unknown bacterium isolated from aiptasia using molecular, biochemical, and phenotypic methods. Preliminary results from 16S sequencing produced approximately 97% sequence identity to six closely related α-proteobacterial species. The Superoxide Dismutase (SOD) gene was selected as a secondary molecular marker and an alignment of the SOD gene sequences from each of the six candidate species was used to identify conserved and variable regions. A degenerate primer was designed from conserved regions identified in the SOD gene alignment and used to amplify the SOD gene for sequencing. A series of metabolic and optimal growth condition tests were also conducted to compare the isolate’s phenotype with the candidate species.
Results support the identification of the isolate as a strain of Tritonibacter mobilis and suggest metabolic and biochemical traits that may be relevant to oxidative stress mitigation and host-associated microbial function. This study demonstrates a practical approach for resolving bacterial identities and characteristics that may be useful in future aiptasia and coral microbiome studies.
Introduction
The sea anemone Exaiptasia diaphana (Aiptasia) is a widely used model system for studying cnidarian symbiosis, particularly for understanding the interactions between members of the holobiont which includes the host, its algal symbiont, and a diverse group of microorganisms which include bacteria, archaea, viruses, and microbial eukaryotes (Sydnor et al., 2023). Both the coral and aiptasia microbiomes in particular have been implicated in nutrient cycling, immune regulation, and protection against environmental stressors (Bourne et al., 2016; MacVittie et al., 2024; Peixoto et al., 2017; Röthig et al., 2016). Microbial community composition shifts are associated with thermal stress and bleaching, suggesting that specific bacterial taxa may influence host tolerance to adverse conditions (Sydnor et al., 2023). Research conducted with aiptasia offers practical advantages over reef-building corals, including ease of culturing, clonal propagation, and experimental manipulation, while retaining key features of coral symbiosis and holobiont interactions (Weis et al., 2008). These similarities enable researchers to investigate biological and environmental stress responses in an organism that is functionally similar to coral.
Probiotic research has explored the potential for leveraging Beneficial Microorganisms for Corals (BMC) to enhance cnidarian resilience (Peixoto et al., 2017). These probiotic approaches aim to select or engineer microbial consortia that can mitigate stress, for example by reducing reactive oxygen species (ROS) or enhancing antioxidant capacity (Peixoto et al., 2017; Rosado et al., 2019). While promising, these strategies are limited by an incomplete understanding of the identity and functional capabilities of many microbiome members.
One of the biggest challenges to researching coral probiotics is actually culturing each bacterial species. This is largely due to the unknown metabolic and environmental requirements of each species (Stewart, 2012; Sweet et al., 2021). Currently, most of what is known about the coral and aiptasia microbiome comes from sequencing-based approaches, particularly 16S rRNA sequencing. Although metagenomic sequencing of the 16S rRNA gene is a powerful tool for surveying microbial diversity, its high conservation limits its ability to resolve closely related taxa at the species or strain level (Janda & Abbott, 2007; Johnson et al., 2019). These limitations are further compounded by the proliferation of bacterial strains within a species and their capacity for horizontal gene transfer within and between species (Prakash et al., 2007). Additionally, sequence-based identification alone provides limited insight into metabolic function, ecological role, or physiological capabilities (Stewart, 2012).
To overcome these challenges, microbial systematics increasingly relies on a Polyphasic approach to bacterial identification, which integrates molecular, biochemical, and phenotypic data to achieve more robust taxonomic resolution and functional characterization (Chun & Rainey, 2014; Vandamme et al., 1996). By combining multiple lines of evidence, polyphasic approaches can distinguish closely related organisms that are indistinguishable by 16S alone and provide insight into their ecological and physiological roles (Chun & Rainey, 2014; Prakash et al., 2007; Vandamme et al., 1996).
This study applies a polyphasic framework to improve the taxonomic resolution of an unknown bacterium isolated from Exaiptasia diaphana. By integrating molecular, biochemical, and phenotypic analyses, this study aims to address the limitations of 16S-based identification and contribute to a more comprehensive understanding of cnidarian-associated microbiomes and their potential functional roles.
Materials and Methods
Aiptasia clonal strain CC7 was kept in a 1 gallon tank, each with a small bubbler filter in Instant Ocean Artificial Seawater (ASW) at a salinity level of 35ppt and kept at temperatures between 25 – 27℃. Light was provided at approximately 70 µmol·m-2·s-1 for 12 hours each day. Aiptasia were fed brine shrimp once each week and tanks were cleaned with a complete water change after feeding. The bubbler portion of the filter was gently scrubbed to remove visible algae and detritus and the sponge filter was gently squeezed in clean ASW to remove large bits of detritus only. Aiptasia were not fed 1 week prior to experimental protocol to avoid contamination from brine shrimp.
Tissue sample collection and cell separation
A tissue sample was collected from three aiptasia polyps whose oral disks were at least 1cm in diameter. The polyps were rinsed in sterile artificial seawater (SASW) and then macerated using a centrifuge tube pestle. The macerated tissue was further homogenized using a 19 gauge needle for approximately ten passes and then a 20 gauge needle for approximately ten passes until the sample was a homogenous slurry.
In order to separate the host tissue from the Symbiodinium, a discontinuous gradient of Percoll solution was used based on protocols described by (Hill et al., 2024; MilliporeSigma, n.d.; Peng et al., 2010; Schultz et al., 2022; Ziegler et al., 2017). A Stock Isotonic Percoll (SIP) solution consisting of nine parts Percoll and one part 5.5 M solution of NaCl in Deionized water. The following concentrations of SIP were created by mixing SIP and SASW to create 100% SIP, 80% SIP, 50% SIP, and 25% SIP solutions. A discontinuous gradient was built by layering 2mL of each SIP concentration in the following order: 100%, 80%, 50%, and 25%. The homogenized aiptasia tissue suspended in SASW was layered on top of the gradient and then centrifuged at 5,000xg for 15 minutes.
The fraction containing the Symbiodinium cells was filtered through a 30 µm, 20 µm, and a 15 µm filter to remove large debris and any remaining host cells (figure 4). The final filter was 5µm and small enough to catch the majority of the Symbiodinum cells which were then resuspended in 1 mL of SASW. The resuspended cells were then diluted up to 10-4 and plated on 2x dilute Zobell’s marine broth amended with 1 g/L of glucose. All plates were then placed in an incubator at 26℃ for 2-3 days.
Species Identification with the 16S rRNA gene
One isolate was selected based on colony morphology (fig. 1a) and plated using the 4-quadrant streak plate technique to ensure a pure culture was isolated (fig. 1b).
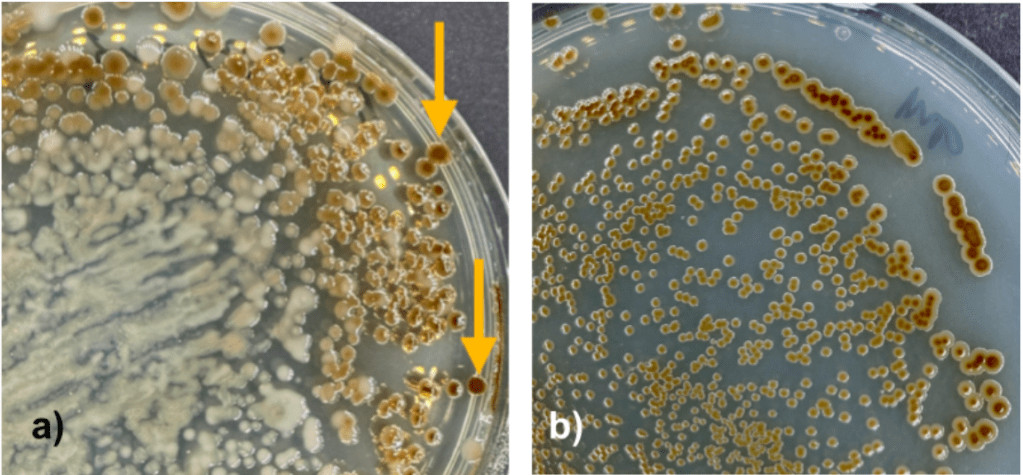
Figure 1: a) Initial plate results from plated Symbiodinum cells. Arrows indicate examples of colony morphology for the selected isolate, b) pure culture plate.
DNA was extracted using Zymo Research’s Quick-DNA Fungal/Bacterial Microprep kit. DNA was amplified via PCR and sequenced by Eurofins Genomics using sanger sequencing. The sequenced results were run through the NCBI database using the BLAST tool to identify the isolate
Secondary molecular marker
A phylogenetic tree was generated in NCBI from the top 13 matches for the 16S gene and used to identify more closely related species. Then an alignment of these closely related species’ SOD gene sequences was created using Clustal Omega. The forward and reverse primers were designed using conserved regions identified in the alignment.
The SOD gene was amplified via PCR (3 minutes at 95℃, then 35 cycles of 95℃ for one minute, 55℃ for one minute, and 72℃ for two minutes, followed by 72℃ for 5 minutes) and sequenced by Eurofins Genomics using Sanger sequencing. The SOD gene nucleotide sequence was converted to its amino acid sequence using the ExPASy translate tool and 3-D protein models were generated using RCSB Protein Data Bank and Colabfold, Alphafold2 notebook.
Biochemical and Metabolic testing
Gram stain and Cell Morphology
Gram staining was done using the standard differential staining protocol to determine cell wall structure of the isolate. Bacterial smears were heat-fixed onto glass slides, stained with crystal violet, treated with iodine, decolorized with ethanol, and counterstained with safranin. Cells were visualized under a light microscope at 1000× magnification using oil immersion objective and classified as Gram-positive or Gram-negative based on staining characteristics. Cell morphology was assessed from stained preparations, including cell shape, arrangement, and approximate cell size.
Motility
Motility was assessed using stab cultures made with 2x dilute marine broth and semi-solid (0.4%) agar. Bacterial isolates were inoculated by a single stab and incubated at 26℃ for 2-3 days. Motility was determined by the presence of diffuse growth radiating from the point of inoculation, compared to non-motile controls which remained confined to the stab line.
Carbon source
Carbon utilization profiles were determined using defined media containing a single carbon source per condition. The defined media consisted of 3.5% sea salts (Instant Ocean), 10 mM of HEPES (4-(2-hydroxyethyl)-1-piperazineethanesulfonic acid), 200 µM of Potassium phosphate monobasic (KH₂PO₄), 10 µM of Iron(III)Chloride (FeCl₃),10 mM of Ammonium Chloride (NH₄Cl), and 1 mM of DMSP (Dimethylsulfoniopropionate). The following carbon sources were added to separate portions of the defined media broth at a concentration of 10mM; Glucose, Glycerol, Sodium acetate, Disodium succinate, and D-Fructose.
Bacterial cultures were inoculated into media supplemented with individual carbon substrates in triplicate (n=3) in a 96-well plate and incubated 30℃ for 24 hours. Growth was assessed via time-series measurements of optical density (OD600) every 30 minutes.
For solid culture defined media, the Iron(III)Chloride (FeCl₃) was added separately after heat-sterilizing the broth and agar mixture to prevent the iron from precipitating out of the solution. This was accomplished by dissolving the FeCl₃ in a small portion of the total amount of water and filter sterilizing it before adding it to the hot broth and agar mixture.
Salinity
Salinity tolerance was evaluated by culturing isolates in defined media with 10mM of glucose and the following concentrations of sea salts (Instant Ocean); 0.5%, 2%, 3.5%, 6%, 8%, 10%, and 12% . Each salinity concentration was added to a 96-well plate in triplicate (n=3) and incubated 30℃ for 24 hours. Growth was assessed via optical density (OD600) measurements by a plate reader.
Iron-dependency
Iron dependency was assessed by comparing bacterial growth in iron-rich and iron-deficient conditions. Iron-rich broth consisted of 10 µM of Iron(III)Chloride (FeCl₃) in the defined media broth while the iron deficient broth was made without adding any FeCl₃. Both broth types were added to a 96-well plate in triplicate (n=3) and incubated 30℃ for 24 hours. Growth was assessed via optical density (OD600) measurements by a plate reader and total growth was quantified as the area under the curve (AUC). Differences between conditions were evaluated using Welch’s two-sample t-test. Agar plates were made from the defined media broth – both with and without iron in order to compare the effects of iron on colony morphology on static media.
Nitrate Reduction
Nitrate reduction capability was determined using standard nitrate broth assays. Cultures were incubated at 26℃ for 24 hours in media broth containing nitrate and a durham tube to capture any gas production. The reduction was assessed by the addition of nitrate reagents to detect nitrite formation. Results were interpreted based on standard colorimetric outcomes indicating nitrate reduction to nitrite.
Catalase test
Catalase activity was assessed using a standard hydrogen peroxide assay. A small amount of bacterial biomass from a fresh culture (~24 h) was transferred onto a clean glass slide using a sterile loop. One drop of hydrogen peroxide (H₂O₂) was applied directly to the cells. The reaction was immediately observed for the production of gas bubbles. Rapid effervescence (oxygen release) was recorded as a positive result, while the absence of bubbling indicated a negative result.
Quantification of Growth
For the carbon source, salinity, and iron-dependency testing, growth was quantified as the area under the curve (AUC) of OD600 over time for each replicate using the trapezoidal rule. This approach captures cumulative growth across the full duration of the experiment and allows comparison of overall growth performance between conditions (Borchers, 2025).
Statistical Analysis
Statistical analyses were conducted in R (R Core Team, 2023). AUC values were calculated for each replicate, and differences between carbon source treatments were assessed using one-way analysis of variance (ANOVA). Post hoc comparisons were performed using Tukey’s honestly significant difference (HSD) test. A significance threshold of α = 0.05 was used for all analyses.
Results
A BLAST analysis of the 16S rRNA amplimer identified the isolate as Tritonibacter mobilis with ≥ 99% identity (fig. 2a). Both 16S nucleotide sequences (from the forward and reverse primers) were aligned and then checked against the electropherogram (fig. 2b and 2c). Any corrections made to the sequence ended up reinforcing the NCBI results. However, there were also five unique differences (fig. 2c, highlighted in blue) that did not correspond to any of the matches in NCBI which suggests that this could be a unique or previously unnamed strain of T. mobilis.
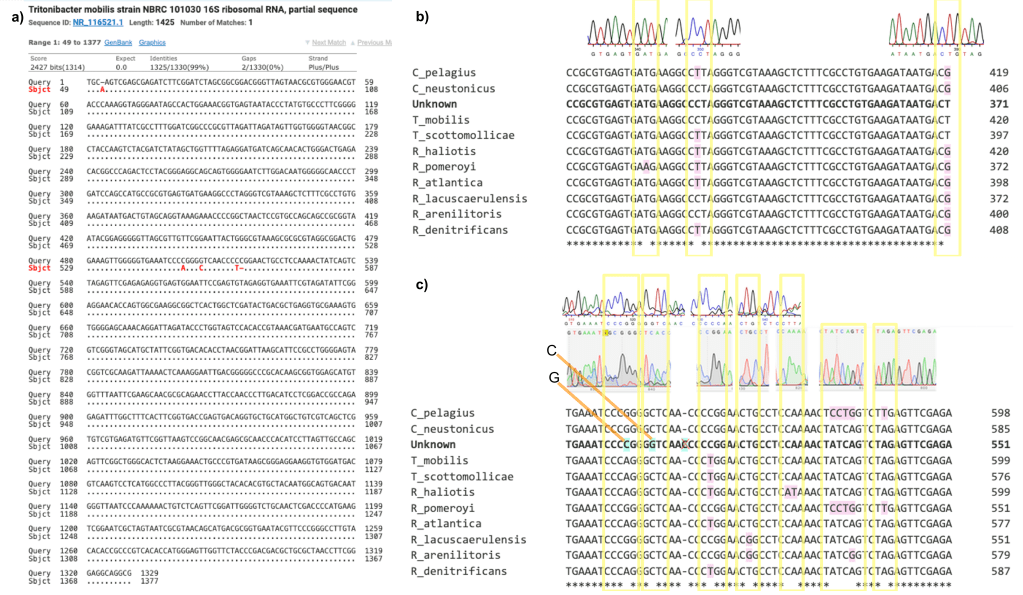
Figure 2: A) 99% match with Tritonibacter mobilis strain NBRC101030 (partial sequence) shows only four nucleotide mismatches, B) All points of disagreement (pink highlights inside yellow box) were cross checked in the electropherogram and any corrections made ultimately reinforced the initial match results, C) Points of disagreement with all the matches were also cross-checked to confirm these were clear and distinct on the electropherogram. There were five unique differences (blue highlight) in the 16S gene for the unknown isolate.
Although T. mobilis matched with 99% identity, there were a few reasons to doubt this identification; first, because the NCBI search results listed three different T. mobilis strains with ≥ 99% identity and four different closely related species matched with ≥ 97% identity, there was some degree of uncertainty as to the species and strain-level identification. Second, prior attempts at similar experiments to isolate bacteria from around the symbiosome in aiptasia resulted in a strongly swarming bacteria whose morphology was very different from this isolate but was also identified as Tritonibacter mobilis.
Figure 3a shows a plate with the swarming bacteria and figure 3b shows a plate with the isolate selected for this study. Finally, figure 3c shows the results of a motility test for the isolate which indicate little to no motility whatsoever. The colony morphology and behavior is dramatically different between the two bacteria which lead to a degree of doubt as to the accuracy of the T. mobilis identification.
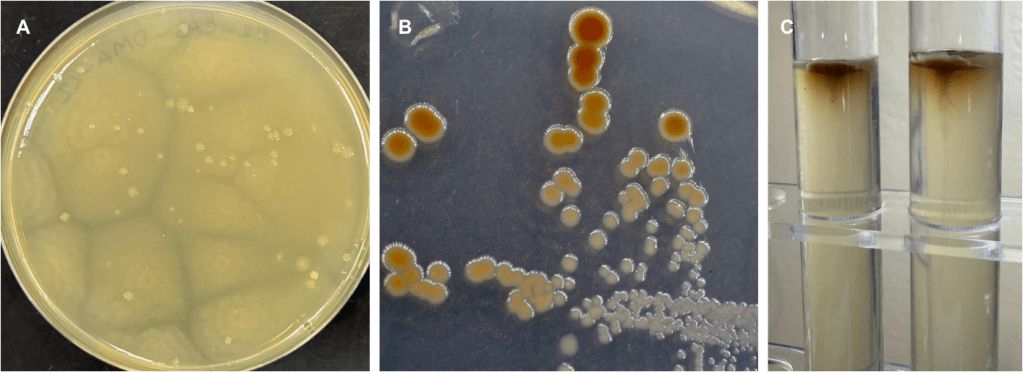
Figure 3: A; initial plate results from prior experiments show strong swarming behavior of isolate identified as Tritonibacter mobilis by 16S rRNA. B; pure culture of the isolate selected for this study was also identified as Tritonibacter mobilis by 16S rRNA but shows no swarming behavior. C; Motility test for selected isolate shows little to no motility.
Locating the Superoxide Dismutase gene
In order to resolve this uncertainty, the Superoxide Dismutase (SOD) gene was used as a secondary molecular marker. Since the NCBI search results for the 16S gene left room for doubt as to the identity of the isolate and there was a significant amount of variability in the 16S gene among the various strains of T. mobilis included in the NCBI search results, additional steps were taken to locate the SOD gene. First, a phylogenetic tree was generated in NCBI from the top 13 results (fig. 4) and then a more closely related subset was identified (yellow highlighted box in fig. 4).
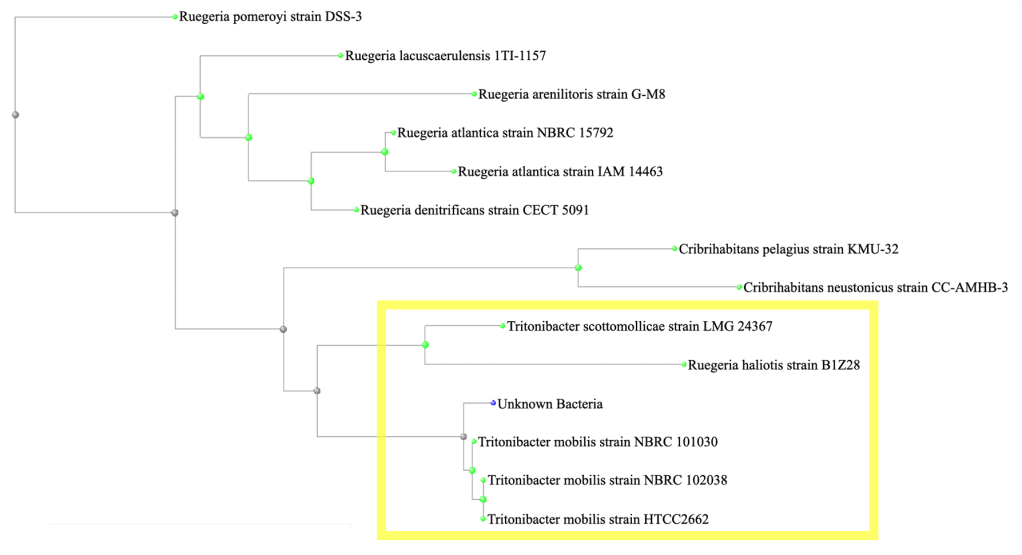
Figure 4: A phylogenetic tree was generated in NCBI from the top 13 matches for the 16S gene and a more closely related subset was identified (yellow highlighted box).
Next, an alignment of the SOD gene sequences from those more closely related species whose genomes were annotated with the SOD gene (Ruegeria haliotis, Tritonibacter scottomollicae, and three different strains of T. mobilis) was created using Clustal Omega. The forward primer (GCGACGTTTTCCCAGTTCAC) was designed using the conserved regions and a degenerate reverse primer (TGGCTTTTGAACTTCCYGAYC) was designed to accommodate shorter conserved regions with limited variability. Below are excerpted sections of the SOD alignment showing the conserved and variable sections used to design the primers.
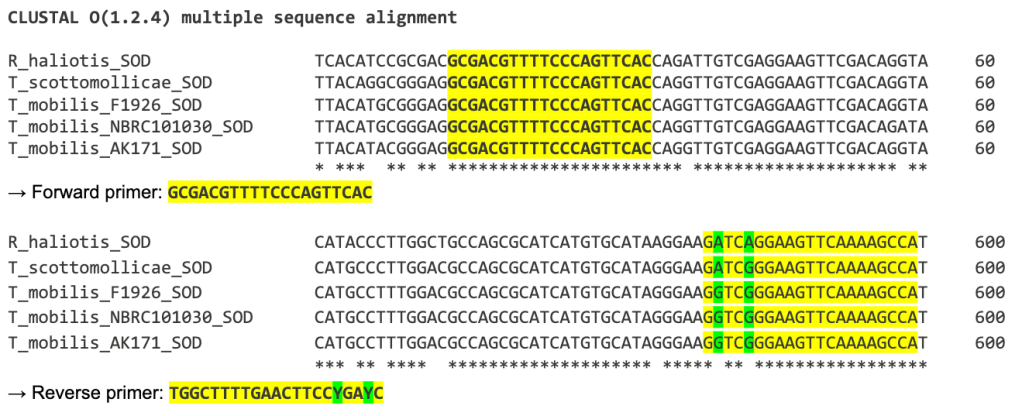
The sequenced results for the forward and reverse primers were checked against the electropherogram and aligned to create the most complete SOD gene sequence possible with the available sequence results.
SOD Nucleotide sequence
>Unknown_isolate_SOD
TGCGACGTTTTCCCAGTTCACCAGGTTGTCGAGGAAGTTCGACAGGTATGCCGGGCGCTTGTTGCGGAAGTCGATGTAGTAGGAGTGCTCCCACACATCACAGCCCAGAAGCGCGGTCTGACCGAAGCACAGCGGGTTCACGCCGTTCTCAGTCTTGGTCACCTTGAGGCCACCATCGGTGTCTTTCACCAGCCACGCCCAGCCGGAGCCGAACTGGCCTGCGCCAGCGGCGGAGAACTCTTCTTTGAATTTGTCGACGGAGCCGAAGGATTCAACCAGAGCCTTTTCCAGCTCGGTCGGCATCGCGCTGCCGTTCGGGCCCATCATTTCCCAGAACTGGTTGTGGTTCCAGAGCTGCGAGATGTTGTTGAAGATGCCATTTTGGGCAACGGCGTCTTTGTTGTAGGTGCCGGTGATGATGTCTTCGAGCGACTTGCCTTCCCACTCGGTACCCGCGATCAGCTTGTTGCCGTTGTCGACATAGGCTTTGTGGTGCAGGTCATGGTGGTATTCCAGCGTCTCGGCGGACATGCCTTTGGACGCCAGCGCATCATGTGCATAGGGAAGGTCGGGAAGTTCAAAAGCCAA
The SOD gene sequence was run through the NCBI database using the BLAST tool and matched seven different strains of Tritonibacter mobilis (Epibacter and Ruegeria are former names for T. mobilis) with ≥ 99% identity (fig. 5). All of the SOD T. mobilis strain matches were different from the strains matched by the 16S gene which supports the possibility that this isolate is most likely a currently unnamed strain of T. mobilis.
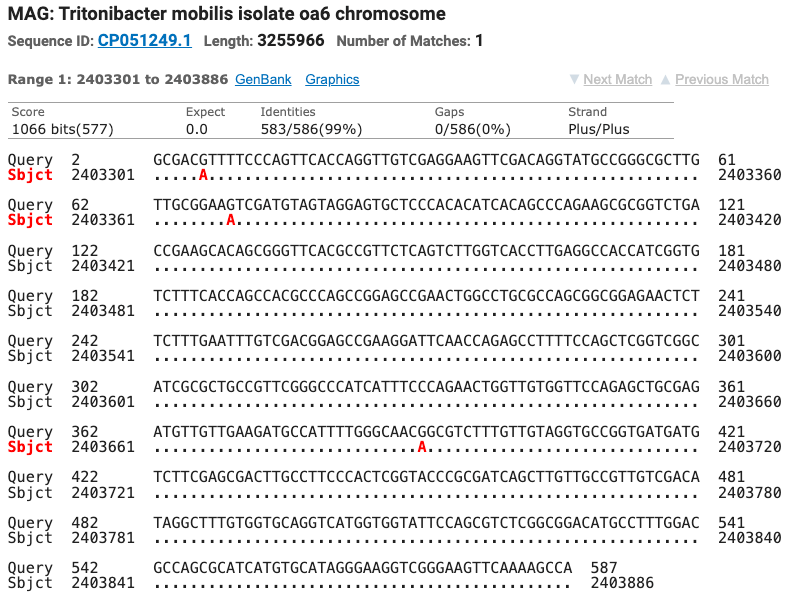
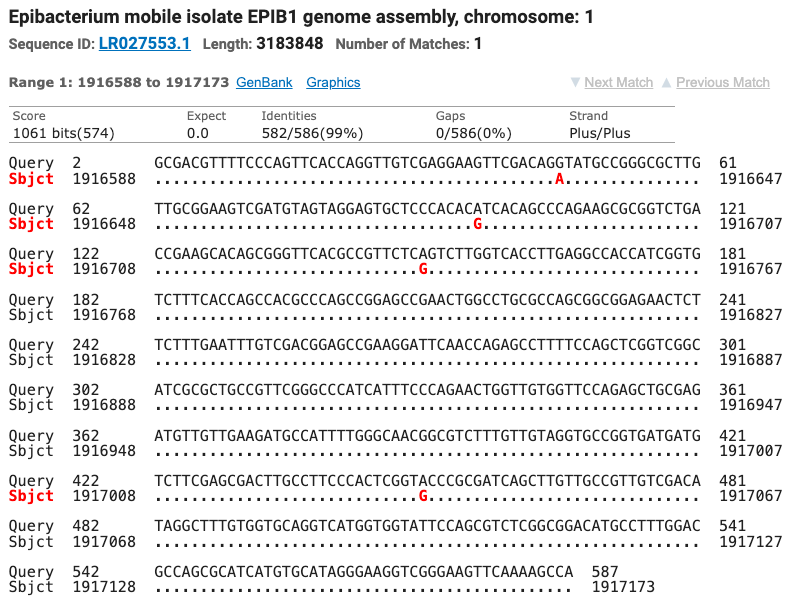
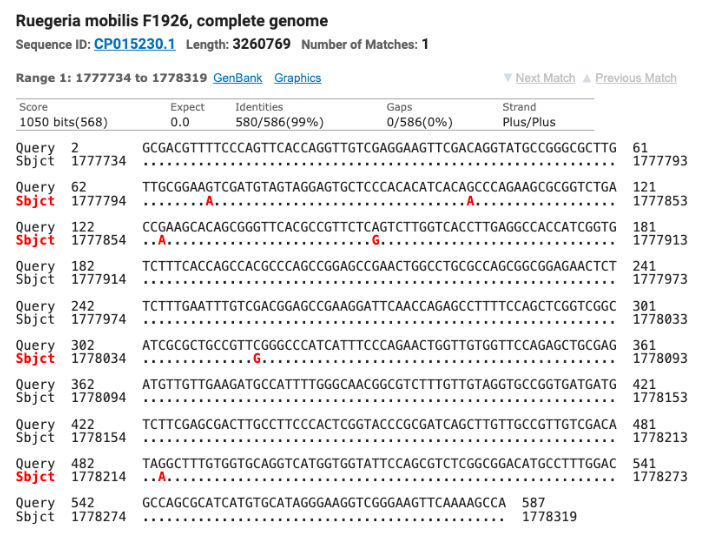
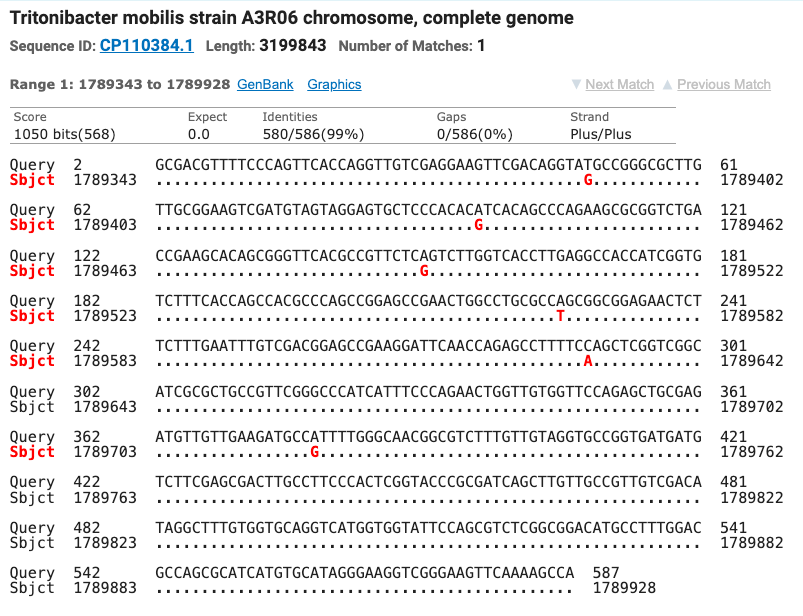
Figure 5: The top four matches for the isolate’s SOD gene. Red letters show the nucleotide differences between the isolate and the matched species.
The secondary molecular marker (SOD gene) confirmed the identity of the isolate but did not resolve the difference in motility between the two examples illustrated in figure 3. In order to resolve this, a series of biochemical and metabolic tests were conducted and the results were compared to literature on the various strains of T. mobilis.
Gram stain, cell morphology, and motility
Initially, the gram stain results showed as gram indeterminate with a consistently pinkish-purple coloration (fig. 6b). However, stains done with colonies before they developed the brown coloration showed as gram negative (fig. 6a). Colony morphology was especially unique in this isolate; the brown coloration appeared after 24 – 48 hours of growth and often exhibited darker color in larger colonies (fig. 6c) which could indicate some degree of quorum sensing connected to production of some compound with that brown color. The motility test (fig. 6d) showed little motility which is contradictory to the literature (Muramatsu et al., 2007; Sarda Carbasse et al., 2025; Schober et al., 2025; Sonnenschein et al., 2017) and previous results (fig. 3a).
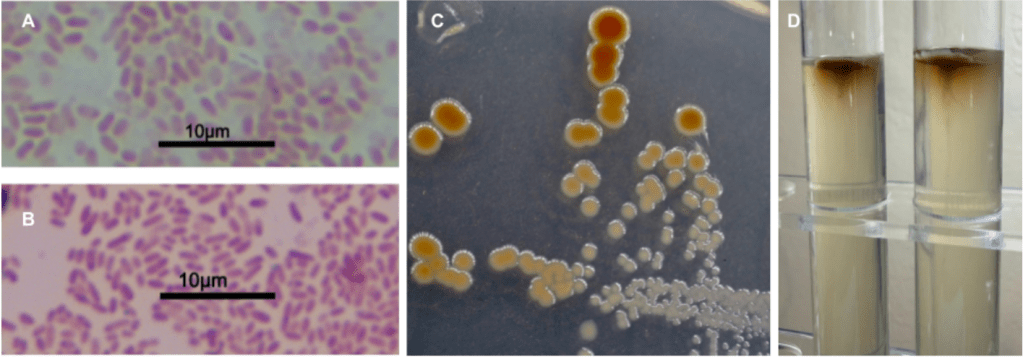
Figure 6: a) Gram stain performed on a colony prior to development of the brown coloration shows gram negative status, b) Gram stain performed on a colony after development of the brown coloration shows gram indeterminate status, c) Streak plate showing a pure culture after 48 hours – smaller colonies show very minimal brown color if any compared to larger colonies, d) motility test shows little to no motility.
Carbon Source Utilization
Carbon utilization testing showed some differences in growth by carbon source (fig. 7). However, due to high variability among the replicates, the standard deviation for each carbon source was large. The overlap of the error bars indicates no statistically significant difference between sources (p-value = 0.47). However, there is some observable difference between the highest and lowest growth curves which, combined with the fact that the test ran too short to record the lag phase of bacterial growth, suggests that it may be worth repeating this experiment with a longer duration and a higher number of replicates.
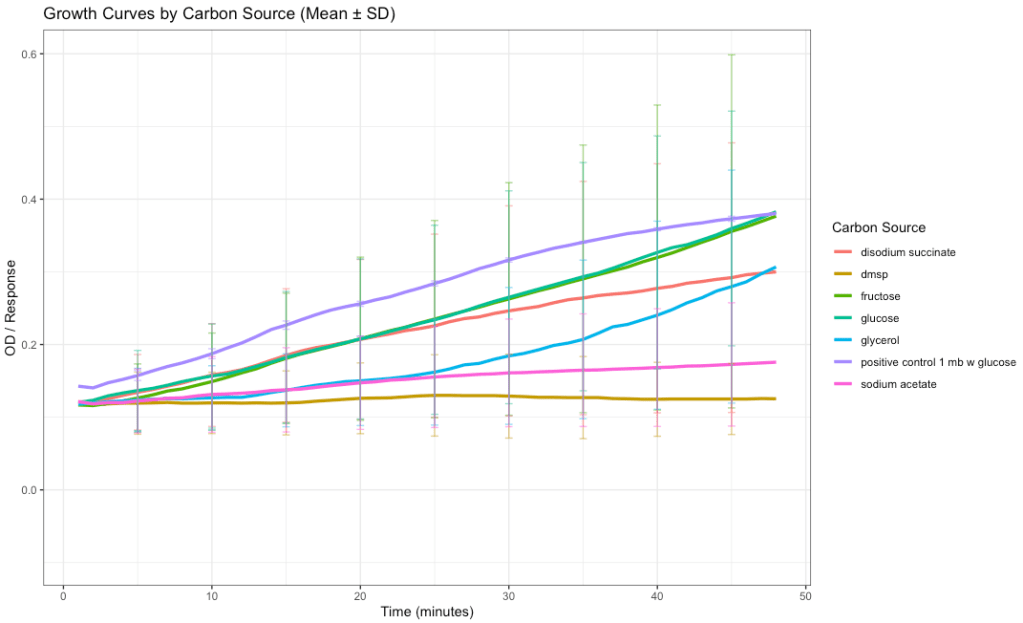
Figure 7: Growth of bacterial isolates across carbon sources. The positive control was zobell’s marine broth amended with glucose at 3.5% salinity. Growth curves showing mean OD600 value over time for each carbon source, with error bars representing ± standard deviation at selected timepoints.
The high degree of variability within the replicates illustrated by the dots in figure 8 indicates there may have been a mechanical/user error when inoculating the wells with bacteria.
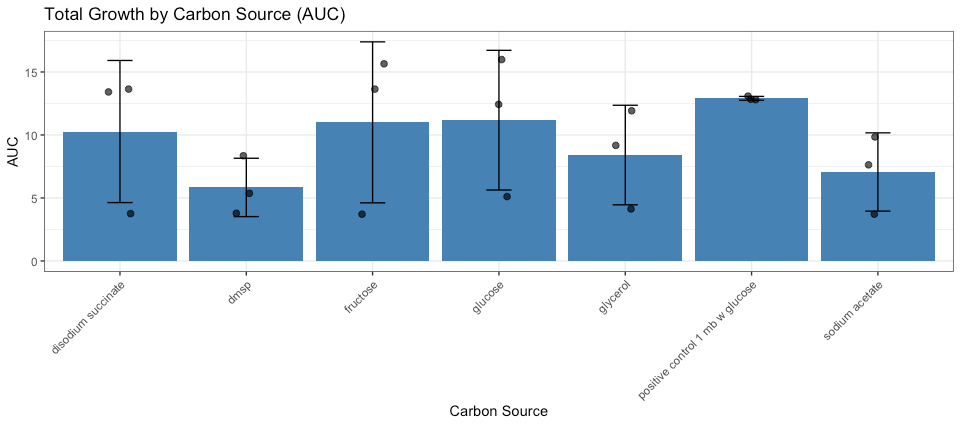
Figure 8: Growth of bacterial isolates across carbon sources. The positive control was zobell’s marine broth amended with glucose at 3.5% salinity. Total growth quantified as area under the curve (AUC) for each replicate. Bars represent mean AUC for each carbon source, error bars indicate ± standard deviation, and points represent individual replicates (n = 3). No statistically significant differences in AUC were detected among carbon sources (one-way ANOVA, p = 0.47).
Salinity Tolerance
The differences in growth between the different salinity levels was statistically significant (p-value = 2.77× 10⁻⁹) indicating that the variance between the groups is much larger than the variance within the groups. Most notably, the highest growth was observed and intermediate salinities (2–6%) while growth was reduced at both the low and high ends of the salinity testing (fig. 9).
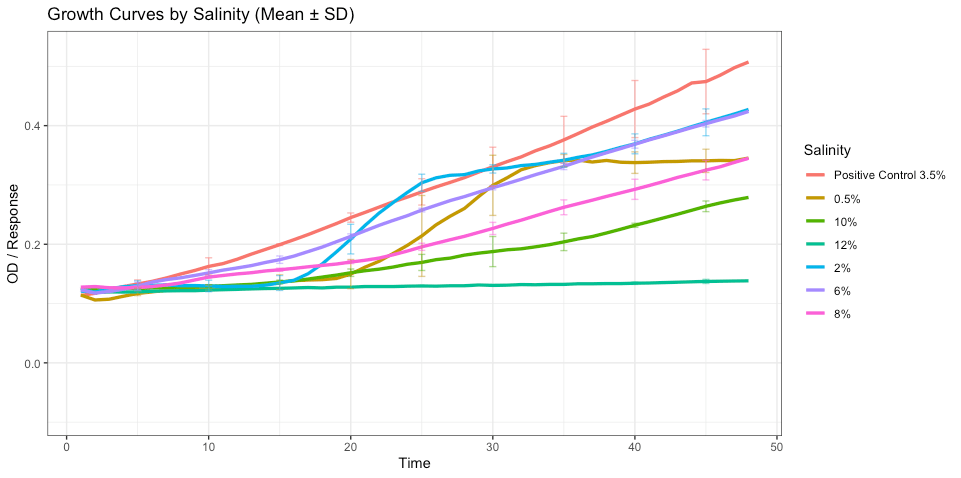
Figure 9: Growth of bacterial isolates across salinity conditions. Growth curves showing mean optical density (OD600) over time for each salinity level, with error bars representing ± standard deviation at selected timepoints. Growth differed significantly across salinity conditions (one-way ANOVA, p = 2.77 × 10⁻⁹), with highest growth observed at intermediate salinities (2–6%) and reduced growth at both low and high salinity extremes.
Optimal salinity testing showed far less variability between the replicates (fig. 10) which increases overall confidence in this data.
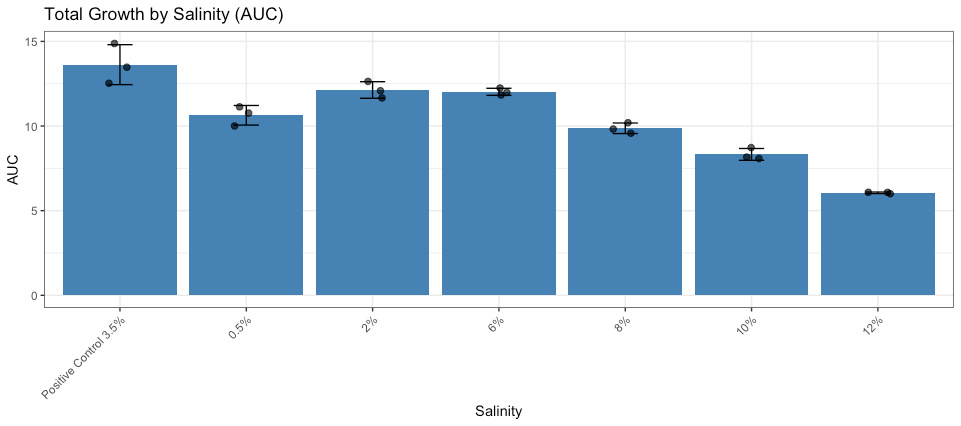
Figure 10: Growth of bacterial isolates across salinity conditions. Total growth quantified as area under the curve (AUC) for each replicate. Bars represent mean AUC, error bars indicate ± standard deviation, and points represent individual replicates (n = 3).
Iron Dependency
The iron-dependency test was included in this study because of prior research findings that Phaeobacter and Ruegeria spp. of the Roseobacter clade produce an antibacterial compound, Tropodithietic acid (TDA) as part of an iron-TDA complex [Fe(III)(TDA)₂]ₓ which has a brown pigmentation and is only observed in colonies grown on iron-rich media (D’Alvise et al., 2016).
No significant difference in growth was observed between iron-rich and iron-deficient conditions in a culture broth (fig. 11a), suggesting that iron availability did not strongly limit growth under the conditions tested. Although mean growth was slightly higher in the iron-rich condition, the difference was not statistically significant (fig. 11b).
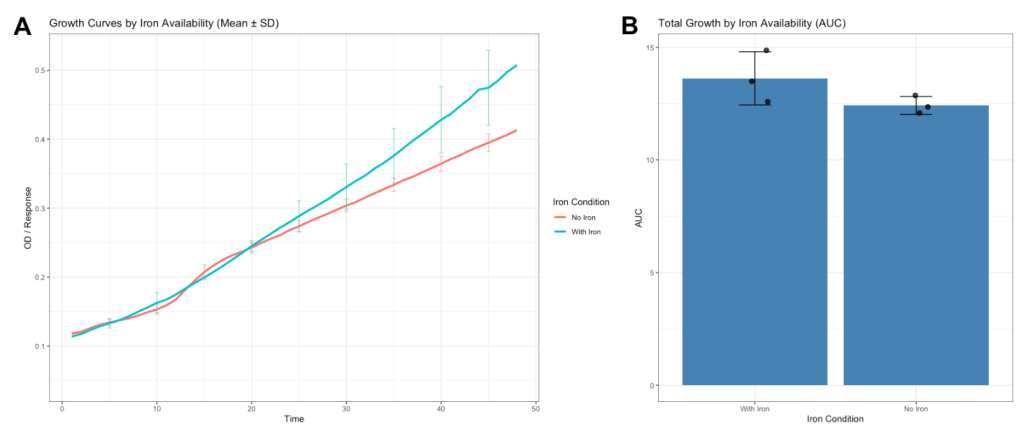
Figure 11. A) Growth of bacterial isolates under iron-rich and iron-deficient conditions. Growth curves showing mean optical density (OD600) over time for each condition, with error bars representing ± standard deviation at selected timepoints. A t-test showed no statistically significant difference in growth curves. B) Total growth quantified as area under the curve (AUC) for each replicate. Bars represent mean AUC, error bars indicate ± standard deviation, and points represent individual replicates (n = 3). No significant difference in growth was observed between iron-replete and iron-deficient conditions (Welch’s t-test, t = 1.68, p = 0.21).
Static growth media showed similar results; media with iron showed larger colony growth with brown pigmentation after ~24 hours while media with no iron showed smaller colonies with no pigmentation (fig. 12). This test was not done with replication and therefore should be interpreted with caution and considered a qualitative rather than quantitative result.
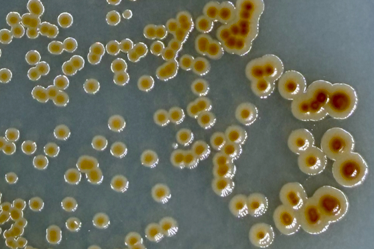
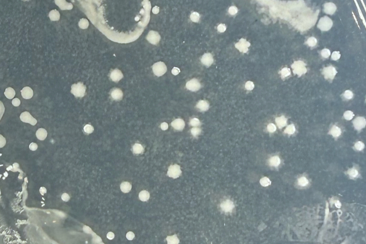
Figure 12. Left: Cultures grown on iron-rich media are larger and develop a brown color after ~24 hours. Right: Cultures grown on media with no iron are smaller and do not develop a brown color.
Nitrate Reduction and Catalase test
The nitrate reduction test was performed to assess the ability of the isolate to reduce nitrate to nitrite or other nitrogenous products. Following incubation, the addition of nitrate reagents produced a distinct pink/red coloration in the test tube (Fig. 13b), indicating the presence of nitrite and a positive nitrate reduction result. The control tube (Fig.13a) remained unchanged in color. No visible gas production was observed in the Durham tube (fig. 13a), suggesting that while nitrate was reduced to nitrite, further reduction to gaseous nitrogen products did not occur under the conditions tested.
It should be noted that the broth used in this assay had a lower salinity than ideal growing conditions demonstrated by the salinity test. Because salinity can influence enzyme activity and overall metabolic function in halophilic microbes (Vauclare et al., 2020), this may have affected the extent of nitrate reduction and lack of gas production observed. Therefore, the results should be interpreted as evidence of nitrate reductase activity under suboptimal conditions, and the organism’s full denitrification capacity may not be fully represented.
The catalase test gave a positive result (fig. 13c) indicating the isolate’s ability to detoxify reactive oxygen species by converting hydrogen peroxide into water and oxygen.
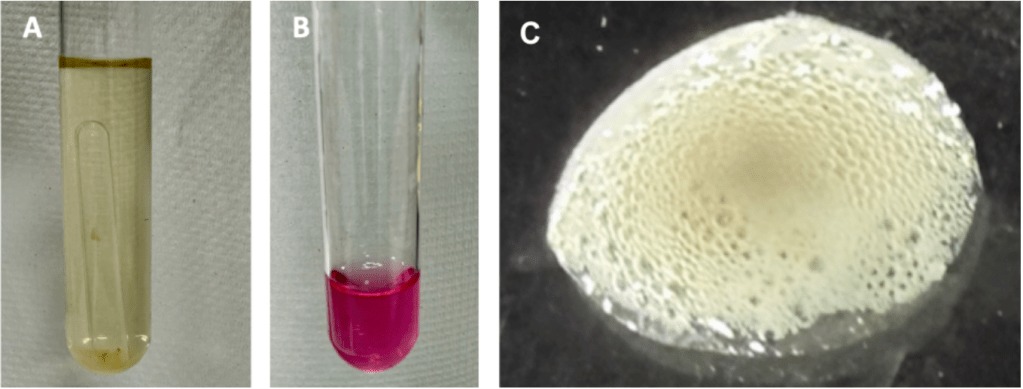
Figure 13. The nitrate reduction test was performed to assess the ability of the isolate to reduce nitrate to nitrite or other nitrogenous products. a) No visible gas production was observed in the Durham tube, b) Following incubation, the addition of nitrate reagents produced a distinct pink/red coloration in the test tube, indicating the presence of nitrite and a positive nitrate reduction result, c) Catalase test showing a positive result. Immediate bubble formation following the addition of hydrogen peroxide indicates catalase activity, reflecting the enzymatic breakdown of hydrogen peroxide into water and oxygen.
Discussion
Although the top NCBI matches for the 16S rRNA gene (≥97% identity) were all Tritonibacter mobilis strains, there was some uncertainty in this classification. The distinctive colony morphology observed in the unknown isolate was described in some of the literature (Alghamdi et al., 2024; D’Alvise et al., 2014; Sonnenschein et al., 2017), but not consistently. Notably, one paper described T. mobilis AK171 as developing brown pigmentation after ~24 hours (Alghamdi et al., 2024), which is consistent with what was observed in this isolate. However, the isolate exhibited little to no motility, which is inconsistent with reported characteristics of T. mobilis. Analysis of the SOD gene (≥99% identity) also produced matches primarily to T. mobilis, albeit to a different set of strains than those identified by 16S gene. This supports the conclusion that the isolate is, in fact, T. mobilis, but possibly a new, or previously unnamed strain of T. mobilis.
Metabolic and Biochemical
Growth varied somewhat across carbon sources, with the highest mean AUC observed in glucose and fructose treatments and the lowest in DMSP. This is consistent with known microbial preferences for readily metabolizable sugars over more complex or specialized substrates (Görke & Stülke, 2008). However, substantial variability among replicates resulted in no statistically significant differences between treatments (ANOVA, p = 0.47). The relatively large standard deviations observed in AUC values is due to a known mechanical problem with experimental set-up when inoculating the wells with bacteria. The lack of statistical significance may also be due to the duration of the experiment; environmental bacteria, such as this isolate, often grow more slowly, especially those commonly found on organisms that live in oligotrophic environments as is the case with coral and other organisms that host autotrophic symbionts. Despite the lack of statistical significance, the observed trends indicate differential substrate utilization that may warrant further investigation with increased experimental duration and higher replication.
Growth differed significantly across salinity conditions, indicating that salinity is a major determinant of growth in this species. Maximum growth was observed at intermediate salinities (2–6%), while both lower (0.5%) and higher (8–12%) salinity conditions resulted in reduced growth. The positive control matched salinity conditions in natural marine environments (3.5% salinity) and exhibited the highest overall growth. This pattern suggests the presence of an optimal salinity range of 2–6% which is within the range reported in literature on T. mobilis (Barberán et al., 2017; Qi et al., 2023; Sarda Carbasse et al., 2025).
No significant difference in growth was observed between iron-rich and iron-deficient conditions, suggesting that iron availability did not strongly limit growth under the conditions tested. Although mean growth was slightly higher in the iron-rich media, the difference was not statistically significant, and confidence intervals indicated substantial overlap between conditions. Despite the lack of significant difference in growth based on the presence or absence of iron in broth media, the absence of brown pigmentation in the colony morphology on static media when iron is also absent supports the likelihood that this isolate is a producer of the antibacterial compound TDA iron complex [FeIII(TDA)2]x (D’Alvise et al., 2016).
While metabolic and biochemical tests mostly supported the identity of the isolate as Tritonibacter mobilis, the discrepancy in motility might be answered by looking more broadly at the Roseobacter clade. Many Roseobacter members form a symbiosis with micro- or macro-algae in a sessile state as part of a biofilm, however, they can also be found in a planktonic, motile state (D’Alvise et al., 2014). This bi-phasic lifestyle is often referred to as a “swim or stick” lifestyle and the transition between phases is controlled by cyclic diguanylic acid (c-di-GMP), which is a small non-protein molecule that relays signals received by cell-surface receptors to effector proteins in order to regulate some aspect of the cell’s biology (Newton et al., 2016). This small molecule is called a second messenger signalling system (D’Alvise et al., 2014; Park & Sauer, 2022; Römling et al., 2013) and it controls a wide range of cellular function in bacteria including transitions from motile to sessile (Hwang & Harshey, 2023; Park & Sauer, 2022). While there are a wide range of environmental conditions that can signal the switch from motile to sessile (Park & Sauer, 2022), carbon sources, especially preferred sugars such as glucose can induce the formation of biofilms (Heo et al., 2019) and intracellular concentration of c-di-GMP will change with conditions that promote or prevent biofilm formation (D’Alvise et al., 2014).
The factors and conditions that may induce biosynthesis of c-di-GMP could also be the reason for the lack of motility observed in this isolate. One significant difference between this study and the previous attempt to isolate bacteria the previous semester was the presence of glucose. For this experiment, all marine agar plates were amended with 5.55 mM (~1g/L) of glucose while plates used in the previous attempts were not amended with glucose. The decision to amend the agar with glucose was based on the logical likelihood that bacteria found in the symbiosome have evolved a metabolism that is highly tuned to the products of photosynthesis; glucose which is excreted in significant quantities by the Symbiodinium. Adding glucose to the plates was intended to increase the chances of cultivating microbes in or near the symbiosome.
Conclusion
Based on both molecular and phenotypic evidence, the unknown isolate is most likely a strain of Tritonibacter mobilis, although some uncertainty remains due to variability in reported characteristics across strains. The observed lack of motility, while inconsistent with typical descriptions of T. mobilis, may be explained by the culture conditions used in this study. In particular, the addition of 5.55 mM glucose to agar and broth media may have promoted a sessile, biofilm-associated state, consistent with the “swim or stick” lifestyle described in members of the Roseobacter clade.
These findings highlight the importance of understanding the metabolic and biochemical processes of microbiome members, particularly in the context of coral probiotic research. Improved knowledge of these processes not only facilitates successful culturing of previously difficult-to-grow organisms but also provides insight into the functional roles microbes may play in supporting holobiont health.
Tritonibacter mobilis has been previously studied for its role in oxidative stress responses, including Superoxide Dismutase (SOD) activity. However, additional traits observed or inferred in this study—including the likely production of the antibacterial (TDA)-iron complex and the ability to metabolize dimethylsulfoniopropionate (DMSP), a known free-radical scavenger (Raina et al., 2017)—suggest that this organism may be an especially strong candidate for both anti-pathogenic and sulfur-cycling applications. Together, these characteristics support its potential relevance in future efforts to develop microbial-based strategies for enhancing coral resilience under environmental stress.
Citations
Alghamdi, A. K., Parween, S., Hirt, H., & Saad, M. M. (2024). Unraveling the genomic secrets of Tritonibacter mobilis AK171: A plant growth-promoting bacterium isolated from Avicennia marina. BMC Genomics, 25(1), 672. https://doi.org/10.1186/s12864-024-10555-0
Barberán, A., Caceres Velazquez, H., Jones, S., & Fierer, N. (2017). Hiding in Plain Sight: Mining Bacterial Species Records for Phenotypic Trait Information. mSphere, 2(4), e00237-17. https://doi.org/10.1128/mSphere.00237-17
Borchers, H. W. (2025). pracma: Practical Numerical Math Functions (Version 2.4.6) [Computer software]. https://cran.r-project.org/web/packages/pracma/index.html
Bourne, D. G., Morrow, K. M., & Webster, N. S. (2016). Insights into the Coral Microbiome: Underpinning the Health and Resilience of Reef Ecosystems. Annual Review of Microbiology, 70(Volume 70, 2016), 317–340. https://doi.org/10.1146/annurev-micro-102215-095440
Chun, J., & Rainey, F. A. (2014). Integrating genomics into the taxonomy and systematics of the Bacteria and Archaea. International Journal of Systematic and Evolutionary Microbiology, 64(Pt_2), 316–324. https://doi.org/10.1099/ijs.0.054171-0
D’Alvise, P. W., Magdenoska, O., Melchiorsen, J., Nielsen, K. F., & Gram, L. (2014). Biofilm formation and antibiotic production in Ruegeria mobilis are influenced by intracellular concentrations of cyclic dimeric guanosinmonophosphate. Environmental Microbiology, 16(5), 1252–1266. https://doi.org/10.1111/1462-2920.12265
D’Alvise, P. W., Phippen, C. B. W., Nielsen, K. F., & Gram, L. (2016). Influence of Iron on Production of the Antibacterial Compound Tropodithietic Acid and Its Noninhibitory Analog in Phaeobacter inhibens. Applied and Environmental Microbiology, 82(2), 502–509. https://doi.org/10.1128/AEM.02992-15
Görke, B., & Stülke, J. (2008). Carbon catabolite repression in bacteria: Many ways to make the most out of nutrients. Nature Reviews Microbiology, 6(8), 613–624. https://doi.org/10.1038/nrmicro1932
Heo, K., Park, Y.-H., Lee, K.-A., Kim, J., Ham, H.-I., Kim, B.-G., Lee, W.-J., & Seok, Y.-J. (2019). Sugar-mediated regulation of a c-di-GMP phosphodiesterase in Vibrio cholerae. Nature Communications, 10, 5358. https://doi.org/10.1038/s41467-019-13353-5
Hill, L. J., Messias, C. S. M. de A., Vilela, C. L. S., Garritano, A. N., Villela, H. D. M., do Carmo, F. L., Thomas, T., & Peixoto, R. S. (2024). Bacteria associated with the in hospite Symbiodiniaceae’s phycosphere. iScience, 27(4), 109531. https://doi.org/10.1016/j.isci.2024.109531
Hwang, Y., & Harshey, R. M. (2023). A Second Role for the Second Messenger Cyclic-di-GMP in E. coli: Arresting Cell Growth by Altering Metabolic Flow (p. 2022.09.14.507988). bioRxiv. https://doi.org/10.1101/2022.09.14.507988
Janda, J. M., & Abbott, S. L. (2007). 16S rRNA Gene Sequencing for Bacterial Identification in the Diagnostic Laboratory: Pluses, Perils, and Pitfalls. Journal of Clinical Microbiology, 45(9), 2761–2764. https://doi.org/10.1128/JCM.01228-07
Johnson, J. S., Spakowicz, D. J., Hong, B.-Y., Petersen, L. M., Demkowicz, P., Chen, L., Leopold, S. R., Hanson, B. M., Agresta, H. O., Gerstein, M., Sodergren, E., & Weinstock, G. M. (2019). Evaluation of 16S rRNA gene sequencing for species and strain-level microbiome analysis. Nature Communications, 10(1), 5029. https://doi.org/10.1038/s41467-019-13036-1
MacVittie, S., Doroodian, S., Alberto, A., & Sogin, M. (2024). Microbiome depletion and recovery in the sea anemone, Exaiptasia diaphana, following antibiotic exposure. mSystems, 9(6), e01342-23. https://doi.org/10.1128/msystems.01342-23
Maire, J., Girvan, S. K., Barkla, S. E., Perez-Gonzalez, A., Suggett, D. J., Blackall, L. L., & Van Oppen, M. J. H. (2021). Intracellular bacteria are common and taxonomically diverse in cultured and in hospite algal endosymbionts of coral reefs. The ISME Journal, 15(7), 2028–2042. https://doi.org/10.1038/s41396-021-00902-4
MilliporeSigma. (n.d.). How to Make and Use Percoll Gradients. Retrieved September 3, 2025, from https://www.sigmaaldrich.com/US/en/technical-documents/protocol/cell-culture-and-cell-culture-analysis/mammalian-cell-culture/how-to-make-and-use-gradients-of-percoll
Muramatsu, Y., Uchino, Y., Kasai, H., Suzuki, K.-I., & Nakagawa, Y. (2007). Ruegeria mobilis sp. Nov., a member of the Alphaproteobacteria isolated in Japan and Palau. International Journal of Systematic and Evolutionary Microbiology, 57(Pt 6), 1304–1309. https://doi.org/10.1099/ijs.0.64572-0
Newton, A. C., Bootman, M. D., & Scott, J. D. (2016). Second Messengers. Cold Spring Harbor Perspectives in Biology, 8(8), a005926. https://doi.org/10.1101/cshperspect.a005926
Park, S., & Sauer, K. (2022). Controlling biofilm development through cyclic di-GMP signaling. Advances in Experimental Medicine and Biology, 1386, 69–94. https://doi.org/10.1007/978-3-031-08491-1_3
Peixoto, R. S., Rosado, P. M., Leite, D. C. de A., Rosado, A. S., & Bourne, D. G. (2017). Beneficial Microorganisms for Corals (BMC): Proposed Mechanisms for Coral Health and Resilience. Frontiers in Microbiology, 8. https://doi.org/10.3389/fmicb.2017.00341
Peng, S., Wang, Y., Wang, L., Chen, W. U., Lu, C., Fang, L., & Chen, C. (2010). Proteomic analysis of symbiosome membranes in Cnidaria–dinoflagellate endosymbiosis. PROTEOMICS, 10(5), 1002–1016. https://doi.org/10.1002/pmic.200900595
Prakash, O., Verma, M., Sharma, P., Kumar, M., Kumari, K., Singh, A., Kumari, H., Jit, S., Gupta, S. K., Khanna, M., & Lal, R. (2007). Polyphasic approach of bacterial classification—An overview of recent advances. Indian Journal of Microbiology, 47(2), 98–108. https://doi.org/10.1007/s12088-007-0022-x
Qi, R., Zhang, Y., Qu, W., Wei, J., Xu, H., Liu, Y., Xia, J., & Wang, J. (2023). Characteristics and Mechanism of Heterotrophic Nitrification/Aerobic Denitrification in the Marine Tritonibacter mobilis HN1. Journal of Marine Science and Engineering, 11(12), 2267. https://doi.org/10.3390/jmse11122267
R Core Team. (2023). R: The R Project for Statistical Computing. R Foundation for Statistical Computing. https://www.r-project.org/
Römling, U., Galperin, M. Y., & Gomelsky, M. (2013). Cyclic di-GMP: The First 25 Years of a Universal Bacterial Second Messenger. Microbiology and Molecular Biology Reviews, 77(1), 1–52. https://doi.org/10.1128/mmbr.00043-12
Rosado, P. M., Leite, D. C. A., Duarte, G. A. S., Chaloub, R. M., Jospin, G., Nunes Da Rocha, U., Saraiva, J. P., Dini-Andreote, F., Eisen, J. A., Bourne, D. G., & Peixoto, R. S. (2019). Marine probiotics: Increasing coral resistance to bleaching through microbiome manipulation. The ISME Journal, 13(4), 921–936. https://doi.org/10.1038/s41396-018-0323-6
Röthig, T., Costa, R. M., Simona, F., Baumgarten, S., Torres, A. F., Radhakrishnan, A., Aranda, M., & Voolstra, C. R. (2016). Distinct Bacterial Communities Associated with the Coral Model Aiptasia in Aposymbiotic and Symbiotic States with Symbiodinium. Frontiers in Marine Science, 3. https://doi.org/10.3389/fmars.2016.00234
Sarda Carbasse, J., Schober, I., Koblitz, J., Podstawka, A., & Reimer, L. C. (2025). Tritonibacter mobilis subsp. Mobilis (Muramatsu et al. 2007) Hördt et al. 2020 (Version 10.0) [Dataset]. DSMZ. https://doi.org/10.13145/BACDIVE13786.20251217.10
Schober, I., Koblitz, J., Sardà Carbasse, J., Ebeling, C., Schmidt, M. L., Podstawka, A., Gupta, R., Ilangovan, V., Chamanara, J., Overmann, J., & Reimer, L. C. (2025). Bac Dive in 2025: The core database for prokaryotic strain data. Nucleic Acids Research, 53(D1), D748–D756. https://doi.org/10.1093/nar/gkae959
Schultz, J., Modolon, F., Rosado, A. S., Voolstra, C. R., Sweet, M., & Peixoto, R. S. (2022). Methods and Strategies to Uncover Coral-Associated Microbial Dark Matter. mSystems, 7(4), e00367-22. https://doi.org/10.1128/msystems.00367-22
Sonnenschein, E. C., Nielsen, K. F., D’Alvise, P., Porsby, C. H., Melchiorsen, J., Heilmann, J., Kalatzis, P. G., López-Pérez, M., Bunk, B., Spröer, C., Middelboe, M., & Gram, L. (2017). Global occurrence and heterogeneity of the Roseobacter-clade species Ruegeria mobilis. The ISME Journal, 11(2), 569–583. https://doi.org/10.1038/ismej.2016.111
Stewart, E. J. (2012). Growing Unculturable Bacteria. Journal of Bacteriology, 194(16), 4151–4160. https://doi.org/10.1128/jb.00345-12
Sweet, M., Villela, H., Keller-Costa, T., Costa, R., Romano, S., Bourne, D. G., Cárdenas, A., Huggett, M. J., Kerwin, A. H., Kuek, F., Medina, M., Meyer, J. L., Müller, M., Pollock, F. J., Rappé, M. S., Sere, M., Sharp, K. H., Voolstra, C. R., Zaccardi, N., … Peixoto, R. (2021). Insights into the Cultured Bacterial Fraction of Corals. mSystems, 6(3), e01249-20. https://doi.org/10.1128/mSystems.01249-20
Sydnor, J. R., Lopez, J., Wolfe, G. V., Ott, L., & Tran, C. (2023). Changes in the microbiome of the sea anemone Exaiptasia diaphana during bleaching from short-term thermal elevation. Frontiers in Marine Science, 10, 1130964. https://doi.org/10.3389/fmars.2023.1130964
Vandamme, P., Pot, B., Gillis, M., de Vos, P., Kersters, K., & Swings, J. (1996). Polyphasic taxonomy, a consensus approach to bacterial systematics. Microbiological Reviews, 60(2), 407–438. https://doi.org/10.1128/mr.60.2.407-438.1996
Vauclare, P., Natali, F., Kleman, J. P., Zaccai, G., & Franzetti, B. (2020). Surviving salt fluctuations: Stress and recovery in Halobacterium salinarum, an extreme halophilic Archaeon. Scientific Reports, 10, 3298. https://doi.org/10.1038/s41598-020-59681-1
Weis, V. M., Davy, S. K., Hoegh-Guldberg, O., Rodriguez-Lanetty, M., & Pringle, J. R. (2008). Cell biology in model systems as the key to understanding corals. Trends in Ecology & Evolution, 23(7), 369–376. https://doi.org/10.1016/j.tree.2008.03.004
Ziegler, M., Seneca, F. O., Yum, L. K., Palumbi, S. R., & Voolstra, C. R. (2017). Bacterial community dynamics are linked to patterns of coral heat tolerance. Nature Communications, 8(1), 14213. https://doi.org/10.1038/ncomms14213
